January 2026 stress-tested Bitcoin’s “digital gold” story. We unpack macro triggers, ETF flows, and on-chain signals – plus portfolio moves.

Don't scroll Twitter for crypto news
One email. Five minutes. Everything that matters today
Why Bitcoin’s “Digital Gold” Narrative Failed in January 2026 – And What It Means for Your Portfolio
In January 2026, “Bitcoin = digital gold” stopped sounding like a harmless meme and started looking like a claim you can actually test.
This is a forensic autopsy – macro catalyst → flow reversal → leverage unwind → on-chain behavior – and then the only part that matters: what you do with your allocation next.
Want this kind of no-BS breakdown daily, in a 5-minute read? Subscribe to Web Snack – a daily crypto market brief on what moved, where the money flowed, and what actually matters for your portfolio.
TL;DR
“Digital gold” isn’t a vibe – it’s measurable: correlation, crisis behavior, flow direction.
January 2026 looked risk-off, and BTC behaved more like a risk asset than a hedge.
Flows (ETFs, stablecoins) and leverage (liquidations, open interest) likely amplified the damage.
On-chain helps separate “flush” from “regime shift” (NUPL, STH vs LTH, whales/exchanges).
Your best move depends on your horizon: beginner safety rules ≠ semi-pro tactics.
What does “digital gold” actually mean – in data, not slogans?
It means Bitcoin should hold up better than risk assets during fear spikes and avoid moving in lockstep with equity tech.
If it fails that stress test, it’s not “over” – it just isn’t the hedge the slogan promised.
The minimum definition: crisis behavior, correlation regime, and relative performance vs gold.
At minimum, a “digital gold” asset should do three boring things well: defend during risk-off windows, show a calmer correlation regime than high-beta equities, and not get embarrassed by traditional safe havens in the same week.
January 2026 matters because it gave a clean window to measure those expectations instead of arguing about them.
The “three tests” framework (what would have to be true for the thesis to hold).
Use three tests to keep yourself honest:
Crisis test: In a clear risk-off week, does BTC lose less than risk assets (or at least stabilize faster)?
Correlation test: Does BTC’s correlation to equity tech drop when stress rises, or does it spike?
Flow test: When investors de-risk, do the big pipes (ETFs, stablecoins) show rotation into BTC – or out of it?
What January 2026 forced us to measure (instead of argue about).
January didn’t “disprove Bitcoin forever.”
It forced a measurement mindset: flow direction, leverage stress, and on-chain damage all moved alongside the story breaking.
What broke first in January 2026 – macro, flows, or leverage?
Positioning broke first, and macro was the match that lit it.
Once flows flipped and leverage started snapping, the narrative didn’t just weaken – it got dragged behind price action.
Macro backdrop: Fed pause / inflation prints – what changed in risk appetite.
By late January, the macro message many traders heard was basically: “don’t assume easy liquidity shows up on demand.”
Inflation was cooling versus prior peaks, but that didn’t automatically translate into immediate relief for crowded risk trades.
Flow shock: spot ETF outflows as the “institutional mood ring”.
Spot Bitcoin ETF flows are a blunt but useful “institutional mood ring.”
In late January, reports pointed to a sharp one-day outflow of around -$818M, and monthly outflows of roughly -$1.61B.
Flows don’t have to mean “Bitcoin is finished” to still hit price.
They just need to be real, large, and timed with fragile positioning.
Leverage flush: why liquidations can turn a drawdown into a narrative death spiral.
Leverage is the accelerant.
When forced selling starts, price can move faster than any “store of value” story can adapt.
Around the end of January, reported liquidations reached about $2.53B in a single day, with longs taking most of the hit.
There were also signs of leverage cooling off, including reported open interest down roughly 25% over the month.
Date (UTC) | What happened | BTC move | Spot BTC ETF flows |
|---|---|---|---|
2026-01-13 | US CPI (Dec) released: 2.7% YoY; Core 2.6% YoY | $91,185 | –$509M |
2026-01-28 | Fed holds 3.5%–3.75% | $89,104 | –$19.6M |
2026-01-29 | Gold peaks near $5,608/oz (record) | $89,169 | –$817.8M |
2026-01-30 | Spot BTC ETF outflows spike (risk-off) | $84,562 | –$509.7M |
2026-01-31 | Liquidation flush (long-heavy) | $84,126 | n/a |
2026-02 (month-end) | Net spot BTC ETF flows negative; OI down ~25% | $78,626 | –$1.61B |
These narratives don’t break on Twitter – they break in the data: ETF flows, liquidations, OI, stablecoin moves. I track the signals daily in Web Snack so you can spot regime shifts early (without staring at charts all day).
What did on-chain behavior say – capitulation flush or real regime change?
On-chain suggests “stress and capitulation,” but it doesn’t prove a permanent identity change.
Treat it like diagnostics: it tells you what kind of damage happened, not what must happen next.
NUPL: why this metric is useful, and what “Euphoria → Anxiety” implies (and what it doesn’t).
NUPL (Net Unrealized Profit/Loss) is used as a sentiment proxy built from unrealized PnL.
In January, some analyses described a fast drop in NUPL sentiment bands – framed as “Euphoria → Anxiety” within days.
If that kind of shift is real, it usually means sentiment flipped fast and weak hands got shaken out.
But “oversold” can stay oversold if macro keeps leaning risk-off.
STH vs LTH: who sold, who absorbed, and what “capitulation” looks like on-chain.
A classic capitulation pattern is short-term holders selling into panic while longer-term holders absorb.
Some estimates put short-term holder losses at about $400M/day during the drop toward the high-$70Ks.
There were also claims that around 1.2M BTC sat in unrealized loss by late January.
That’s the kind of setup that can fuel reflexive rallies – but it’s still not a guarantee.
Whale + exchange balance signals: accumulation vs distribution (and the traps).
Whale and exchange-balance narratives are easy to cherry-pick.
If you use them, set rules: multi-week trends only, consistent methodology, no single-screenshot conclusions.
If Bitcoin wasn’t the hedge, where did the money hide instead?
In January, “hide” looked like traditional safe havens and crypto-native cash parking.
The useful move isn’t moralizing – it’s tracking rotation, because rotation explains more than takes do.
The obvious exits: gold and Treasuries (and how to measure rotation without guesswork).
In a risk-off tape, money often buys safety and liquidity.
A big part of the “digital gold” debate reignited because, in that same window, gold looked stronger while BTC sold off.
The clean way to measure “rotation” is simple: normalize BTC vs a gold proxy vs a Nasdaq proxy, then compare it to the flow story.
If you can’t show the chart, you’re guessing – and January punished guessing.
The crypto parking lot: stablecoins (supply, exchange inflows, chain distribution).
Stablecoins are where crypto-native capital waits when conviction drops but it doesn’t want to fully exit.
Early January data showed total stablecoin supply around $269.65B, while the 30-day trend was described as about -$650.1M net outflows.
At the same time, there were reports of +$670M stablecoin inflows to a major exchange over a week and +$900M of stablecoin supply spiking on a major chain over 24 hours.
Read that as tactical repositioning, not “bull market confirmed.”
The “grown-up crypto” bid: RWAs and yield-bearing rails (what to track, not hype).
RWAs are trending because they promise something crypto struggles with during drawdowns: boring, compliant yield rails.
But this space moves fast, so treat numbers as “as of the report,” not timeless truth.
One commonly cited estimate put the RWA market around $24B (mid-2025) and tokenized U.S. Treasuries around $14B+.
The reader-friendly way to cover RWAs is mechanism first (what they are, why they’re attractive in risk-off), then numbers second.
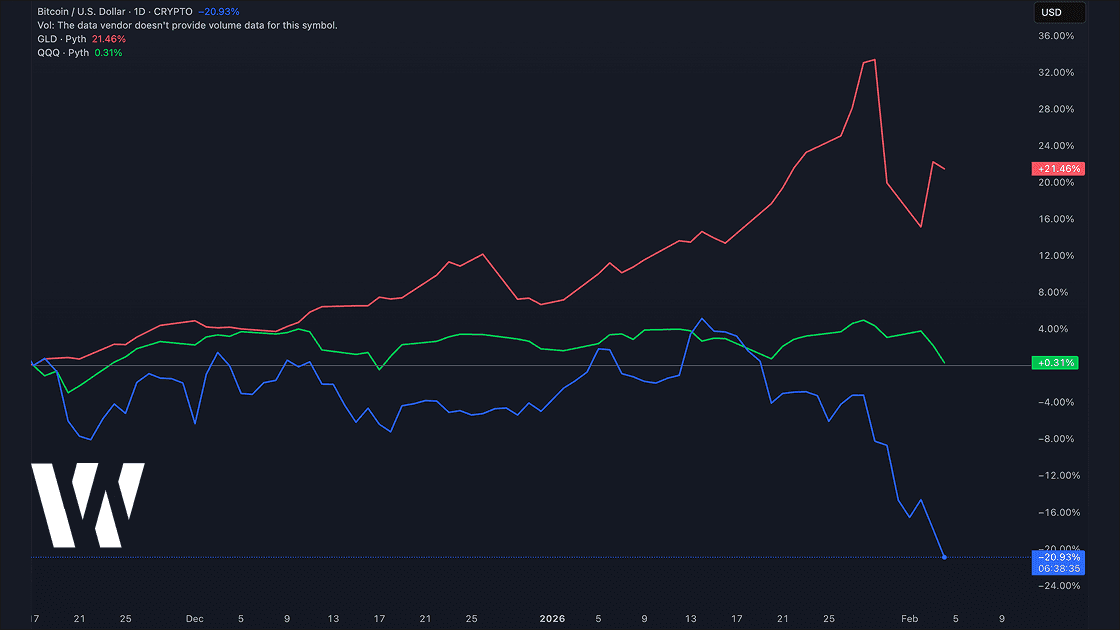
Case study: a January 2026 rotation stress test
Compare BTC, a gold proxy, and a Nasdaq proxy from Jan 1 to Jan 31, 2026, then add one rule: monthly rebalance back to target weights.
You’ll learn something practical: whether your “hedge” actually reduced drawdown or just made the story feel better.
What would Bitcoin have to prove to earn the “digital gold” label back?
It earns the label back only by behaving differently in the next risk-off window – not by telling a better story.
That means correlation, flows, and drawdown dynamics have to improve in measurable ways.
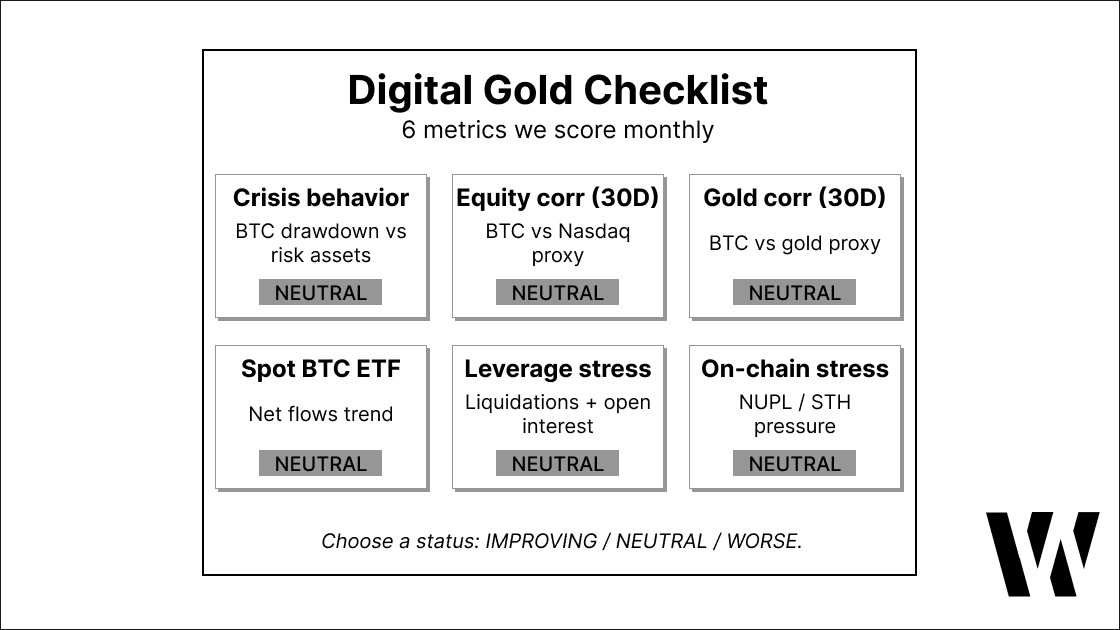
A recovery scorecard: correlation, flows, volatility, and drawdown behavior.
A good scorecard doesn’t predict.
It tells you whether conditions are improving enough to justify adding risk.
A practical scorecard looks like this:
Correlation: BTC vs Nasdaq proxy and BTC vs gold proxy trend (updated consistently).
Flows: spot BTC ETF net flows stabilizing (not just one green day).
Leverage: liquidation intensity and open interest normalizing.
On-chain stress: NUPL regime and short-term holder loss pressure easing.
The “two-week rule” vs overfitting: avoiding narrative whiplash.
Two good weeks can be a squeeze, not a regime shift.
A simple discipline is persistence: don’t change your long-term thesis off a single bounce.
This is less about being right and more about not getting chopped to death.
January was a reminder that narratives are cheap and liquidation is expensive.
A simple monitoring stack: what to check weekly in 10 minutes.
If you only check five things weekly, check these:
30-day BTC correlation to a Nasdaq proxy.
Spot BTC ETF net flows trend (daily sums).
Liquidations + open interest direction (are we re-leveraging?).
Stablecoin supply trend + exchange inflows (is cash coming back?).
One on-chain stress marker (NUPL or short-term holder loss pressure).
Practical takeaways
Beginners (0–6 months in crypto)
Your edge isn’t “timing the bottom.”
It’s not getting wiped out by avoidable mistakes: oversizing and leverage.
Keep BTC position sizing small enough that volatility won’t force you to sell.
If you want a hedge-like feel while the scorecard is messy, pair crypto exposure with boring liquidity elsewhere.
Intermediate (BTC core + some alts)
Your job is to reduce forced-selling risk.
That means rebalancing rules (bands, not vibes) and a written plan for what you do in a deep drawdown.
Respect flows and leverage.
When ETFs are bleeding and liquidations are spiking, rallies tend to be fragile until proven otherwise.
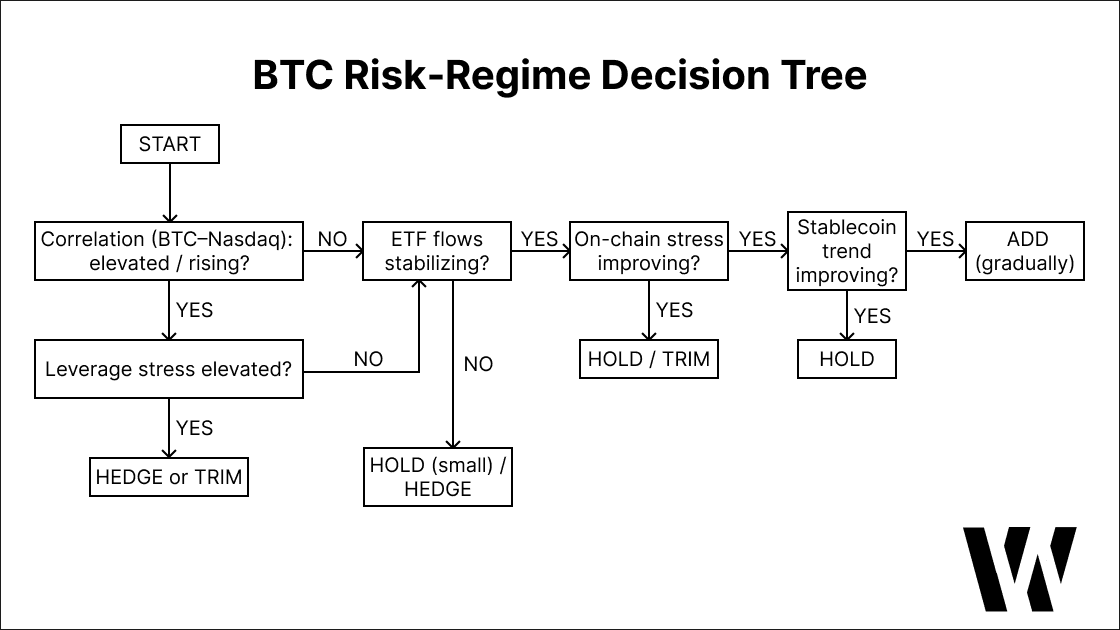
Semi-pro (actively manages risk)
Trade the regime, not the identity story.
If correlation is high and leverage is rebuilding, you can adjust exposure without needing to declare Bitcoin “dead” or “saved.”
Be strict about verification standards for anything numeric.
If the data series isn’t reproducible, it’s not a datapoint – it’s decoration.
Conclusion
January 2026 didn’t just hurt portfolios – it hurt a story many people treated as self-evident.
The upgrade isn’t cynicism; it’s measurement: “digital gold” has to be earned in the data, not repeated into existence.
If the narrative recovers, it’ll show up first in boring places: correlation, flows, leverage, and on-chain stress easing.
Until then, treat BTC like a risk asset allocation and make it resilient to the next risk-off week.
If you want to stay sharp without drowning in noise, subscribe to Web Snack – a daily crypto market overview on risk regime, flows, and the key moves that change positioning. See you in tomorrow’s email.
P.S. This article is for informational purposes only and does not constitute investment advice. Always conduct your own research and make independent decisions.
Like this story? There's more tomorrow
Join Web Snack – no fluff, just value
