Crypto market fell -2.4% over 24 hours, with total cap at $2.94T. Bitcoin dropped -2.0%, while alts like ETH and XRP suffered more amid heavy...

🍪 Today’s Snack
Crypto market fell -2.4% over 24 hours, with total cap at $2.94T. Bitcoin dropped -2.0%, while alts like ETH and XRP suffered more amid heavy ETF outflows and macro pressures from inflation and global uncertainty.
📈 24h Crypto Market Snapshot
Overview of key assets and capitalization
Total crypto market cap dropped to $2.94T, down -2.4% in 24 hours. Fear & Greed Index at 22 - fear, signaling caution and possible oversold conditions.
Asset | Price (USD) | 24h Change (%) | Cap (USD) |
|---|---|---|---|
BTC | 87172 | -2.0 | 1.74T |
ETH | 2936 | -4.3 | 354B |
SOL | 129 | -1.9 | 72B |
BNB | 870 | -1.0 | 120B |
XRP | 1.92 | -1.6 | 116B |
ADA | 0.39 | -3.1 | 14B |
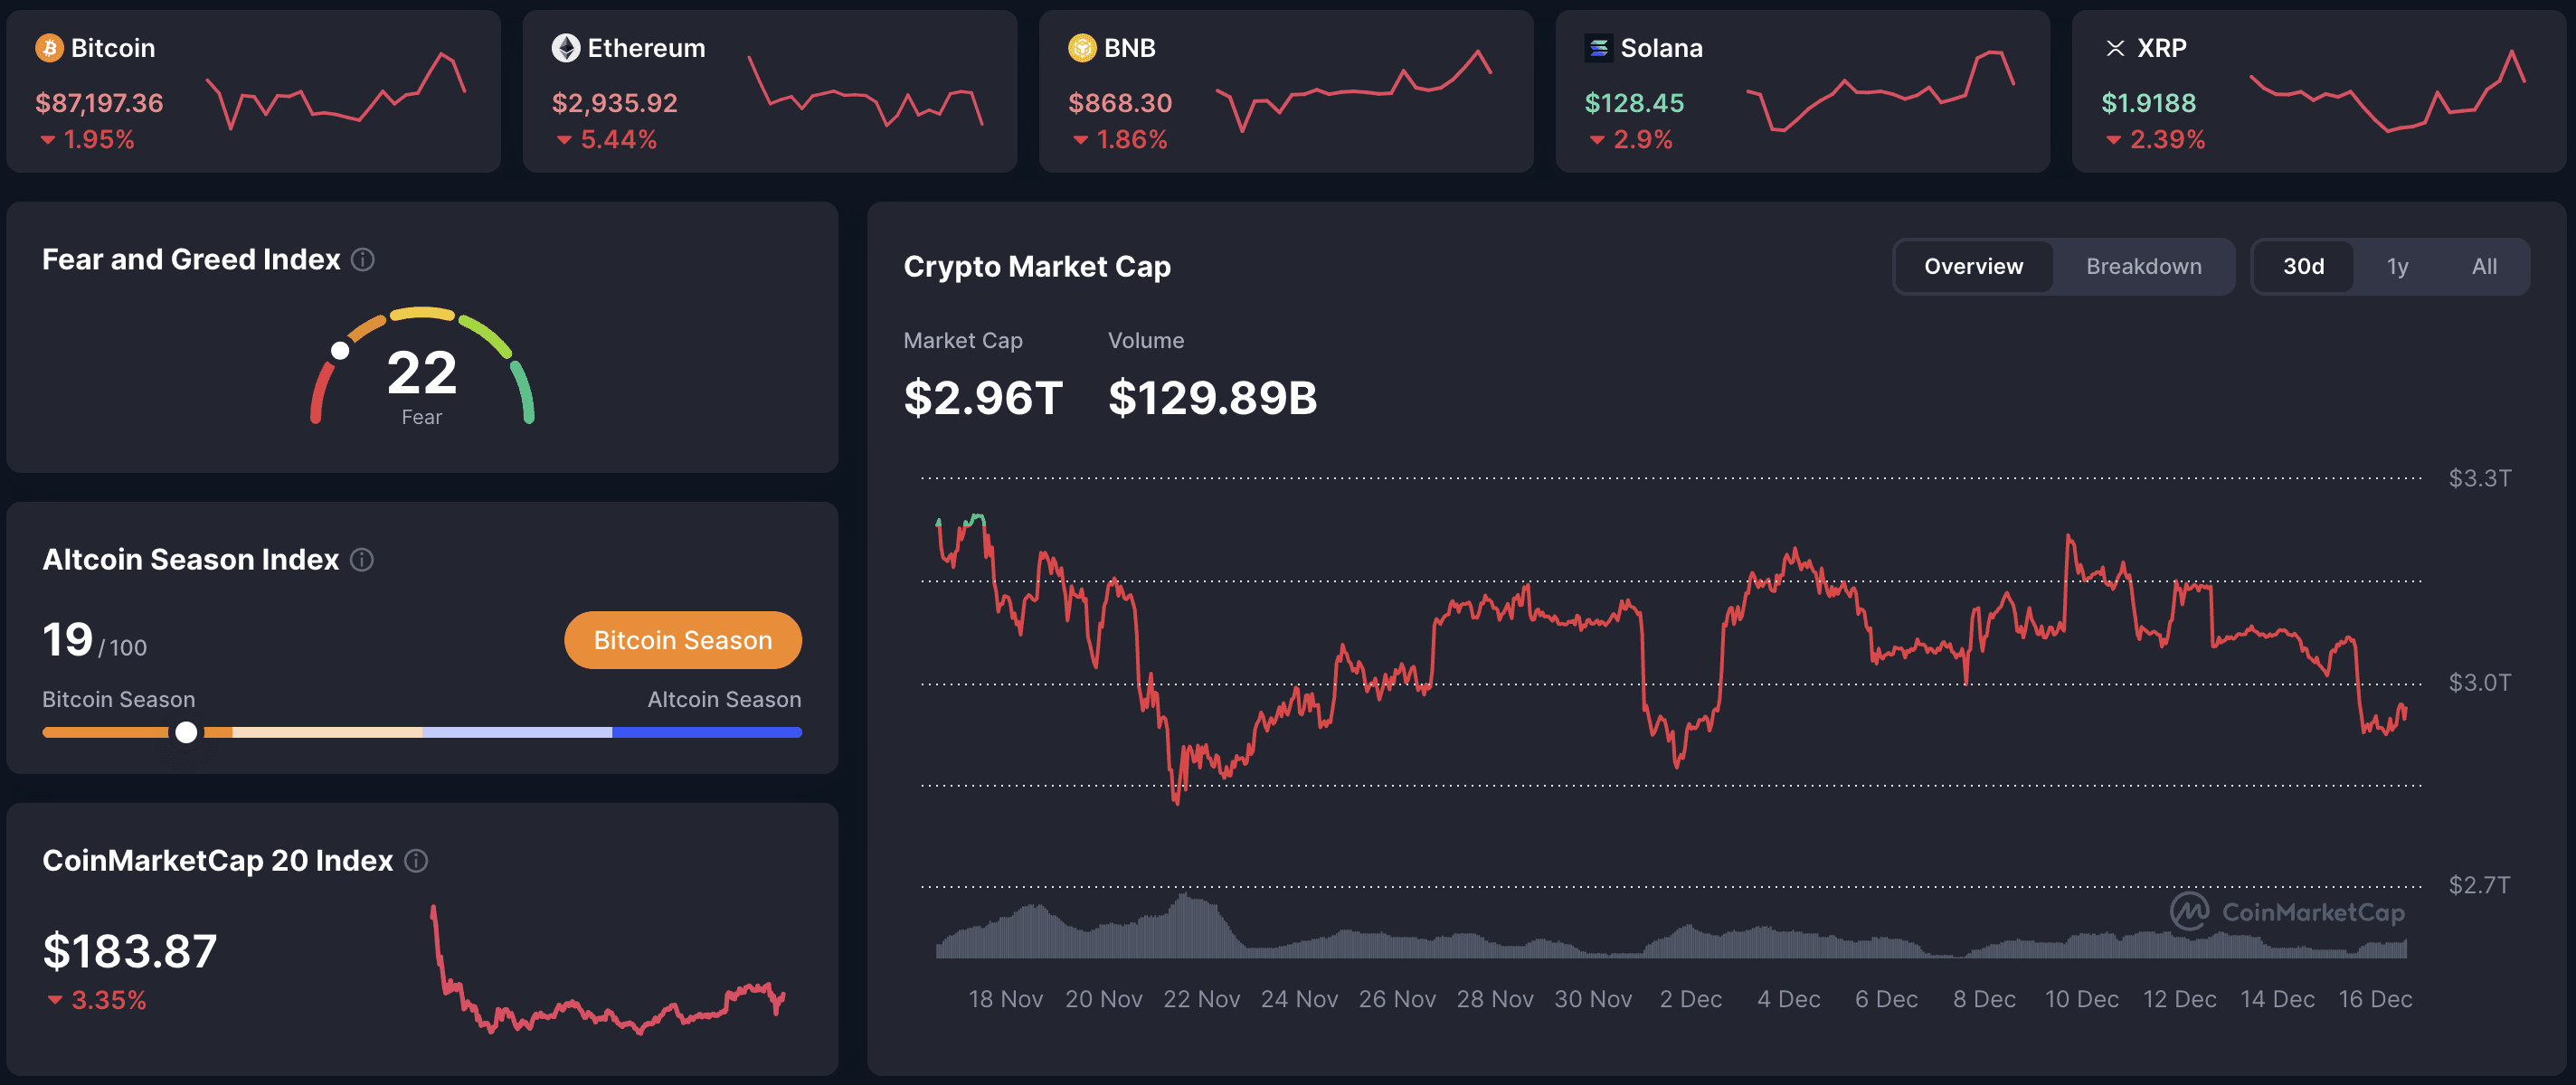
What does Fear & Greed mean? Index from 0 (extreme fear) to 100 (extreme greed) - helps gauge market sentiment. Low values often signal oversold markets with overly pessimistic investors.
🔥 Top 3 Movers & Shakers
Mantle (MNT): +2.9% in 24 hours. Growth linked to Layer-2 ecosystem updates and increased DeFi activity, attracting volume in a down market. Takeaway: Scaling solutions show resilience during dips.
Zcash (ZEC): +2.2% in 24 hours. Boost from privacy-focused news and protocol enhancements, with trading volume up ~10%. Takeaway: Niche privacy coins hold ground in volatile periods.
Tron (TRX): +0.4% in 24 hours. Gains from stablecoin dominance and network upgrades, offsetting alt weakness. Takeaway: Utility in payments supports steady performance.
🏦 ETF & Institutional Flows
Net flows on December 15 showed heavy outflows: Bitcoin ETFs lost $358M, Ethereum ETFs $225M, marking one of the worst days since November 20. Weekly crypto ETP outflows over $800M reflect institutional caution amid macro risks.
Analysis: Outflows reduce liquidity and pressure prices, but historically precede rebounds on stabilization.
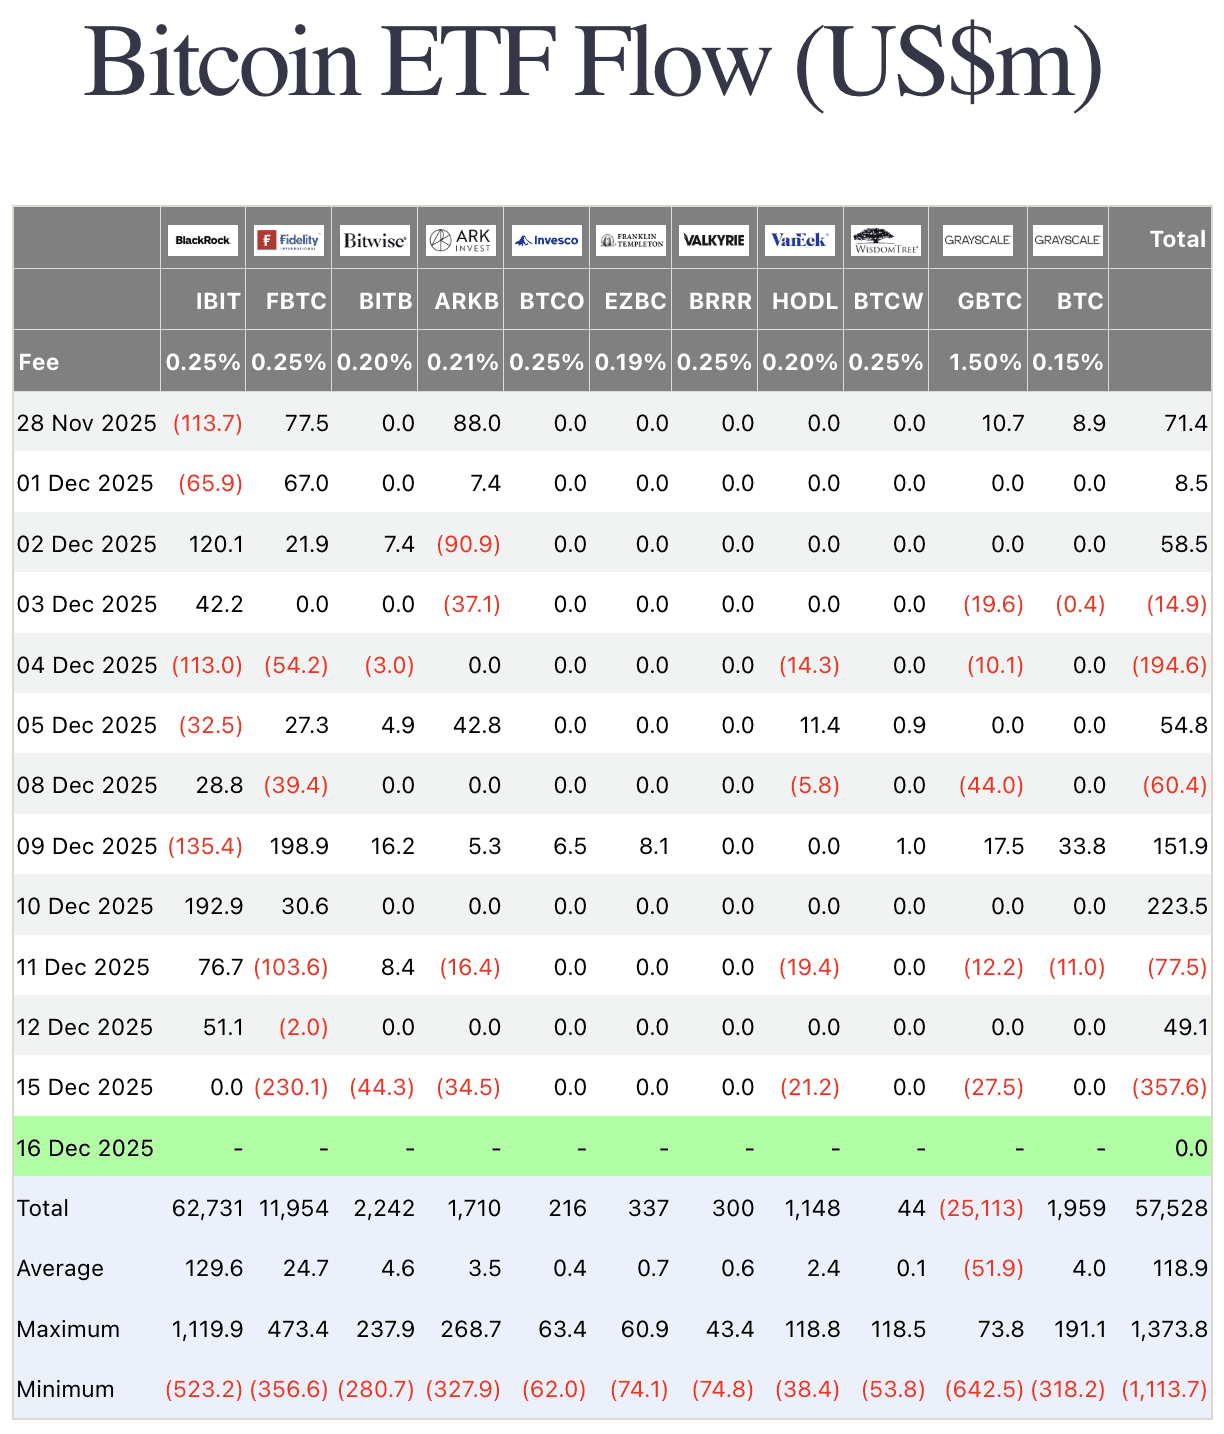
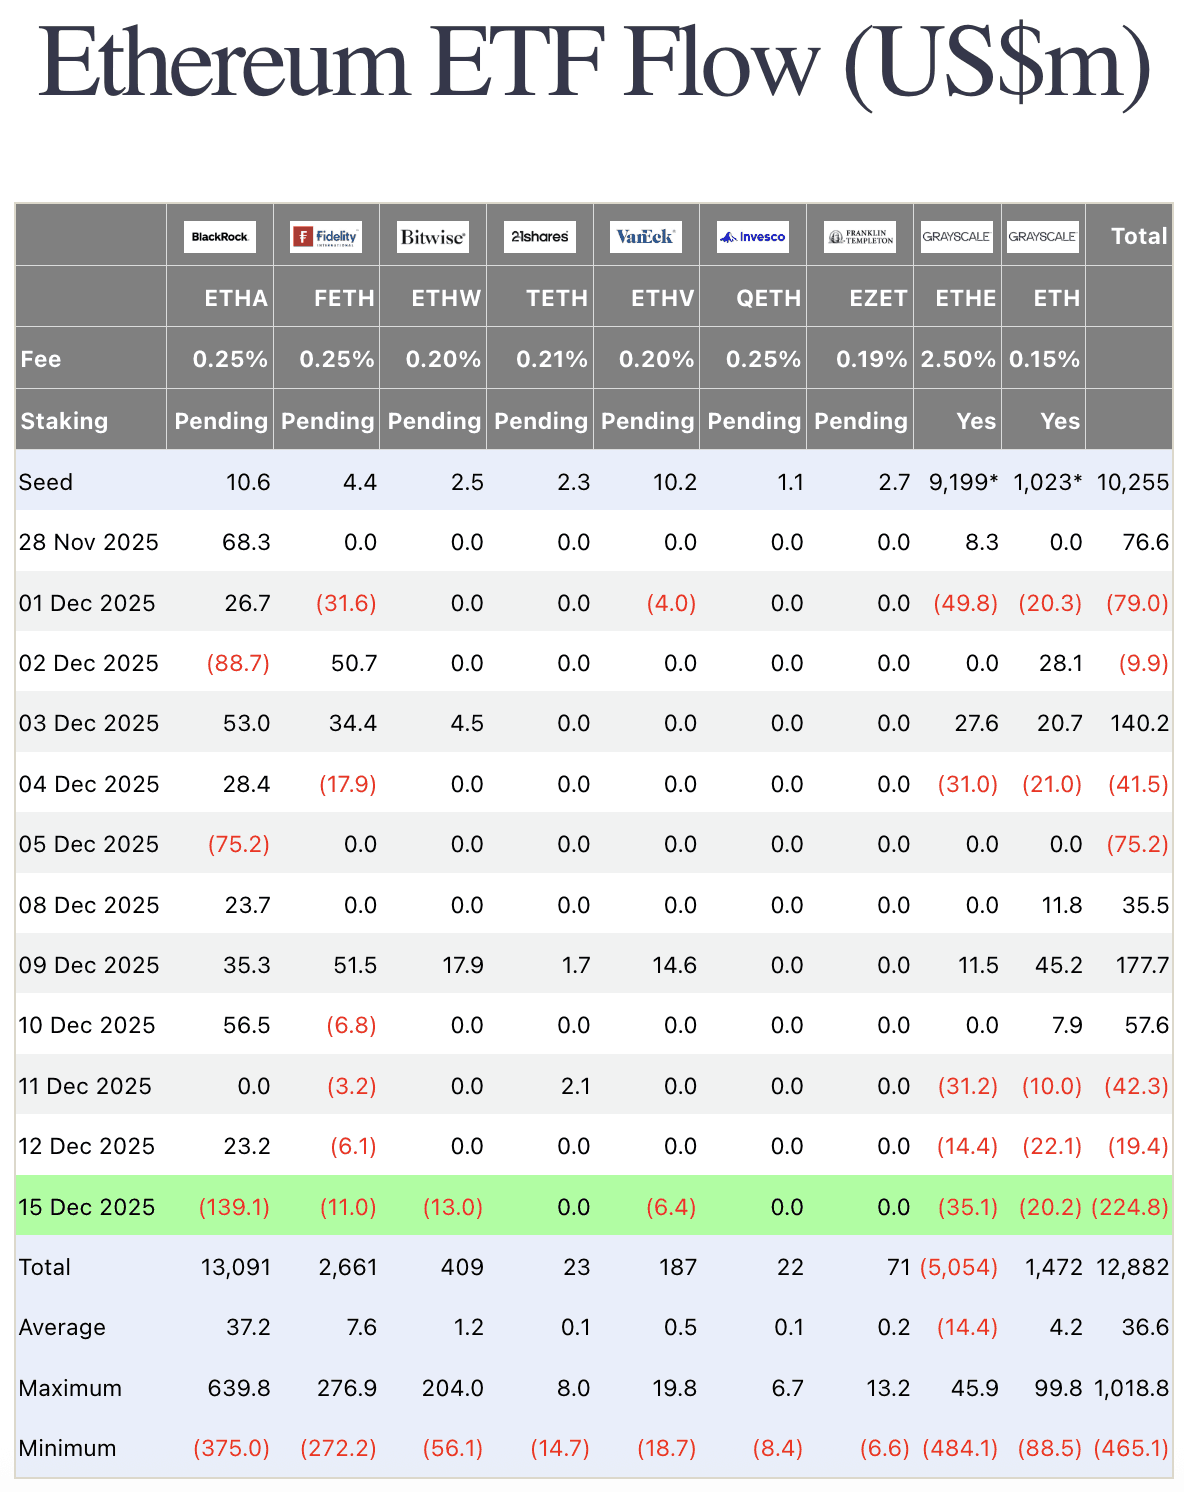
Why track ETFs? These are institutional funds - inflows mean demand, outflows signal caution. They impact liquidity and can hint at trend shifts.
⛓️ On-Chain Metrics
Bitcoin long-term holder supply at ~75% (stable after November low), showing holding despite dips. Whales (1K+ BTC addresses) accumulated net 10K BTC in early December after November selloff, while exchange reserves dropped to ~1.8M BTC. Funding rates averaged -0.005% (negative, shorts dominant).
Takeaway: On-chain suggests large players accumulating, but retail selling adds pressure.
What is on-chain? Data direct from the blockchain - shows real holder behavior, cutting through exchange noise. Helps separate speculation from fundamental demand.
🌍 Macro Pulse
Fed cut rates to 3.50-3.75% on December 10, but inflation stays above 2% due to tariffs and trade tensions, delaying further easing. Unemployment at 4.4% (projected to rise to 4.6% by Q4), with high uncertainty in global economy. This weighs on risk assets like crypto, where correlation with stocks is strong - S&P 500 down -1.2%.
How does Fed affect crypto? Rate cuts boost liquidity for risk assets like BTC. But sticky inflation may pause more cuts, fueling volatility.
💡 Market Trend Spotlight
BTC dominance climbed to 58.6%, as alts lose market share by 4-8%.
On-chain confirms: BTC trading volumes stable, while ETH and SOL see outflows.
Observations: In fear periods, investors flock to "safe" BTC over alts; BTC volume up 8%, solidifying the trend. If dominance hits 60%, alt season may delay further.
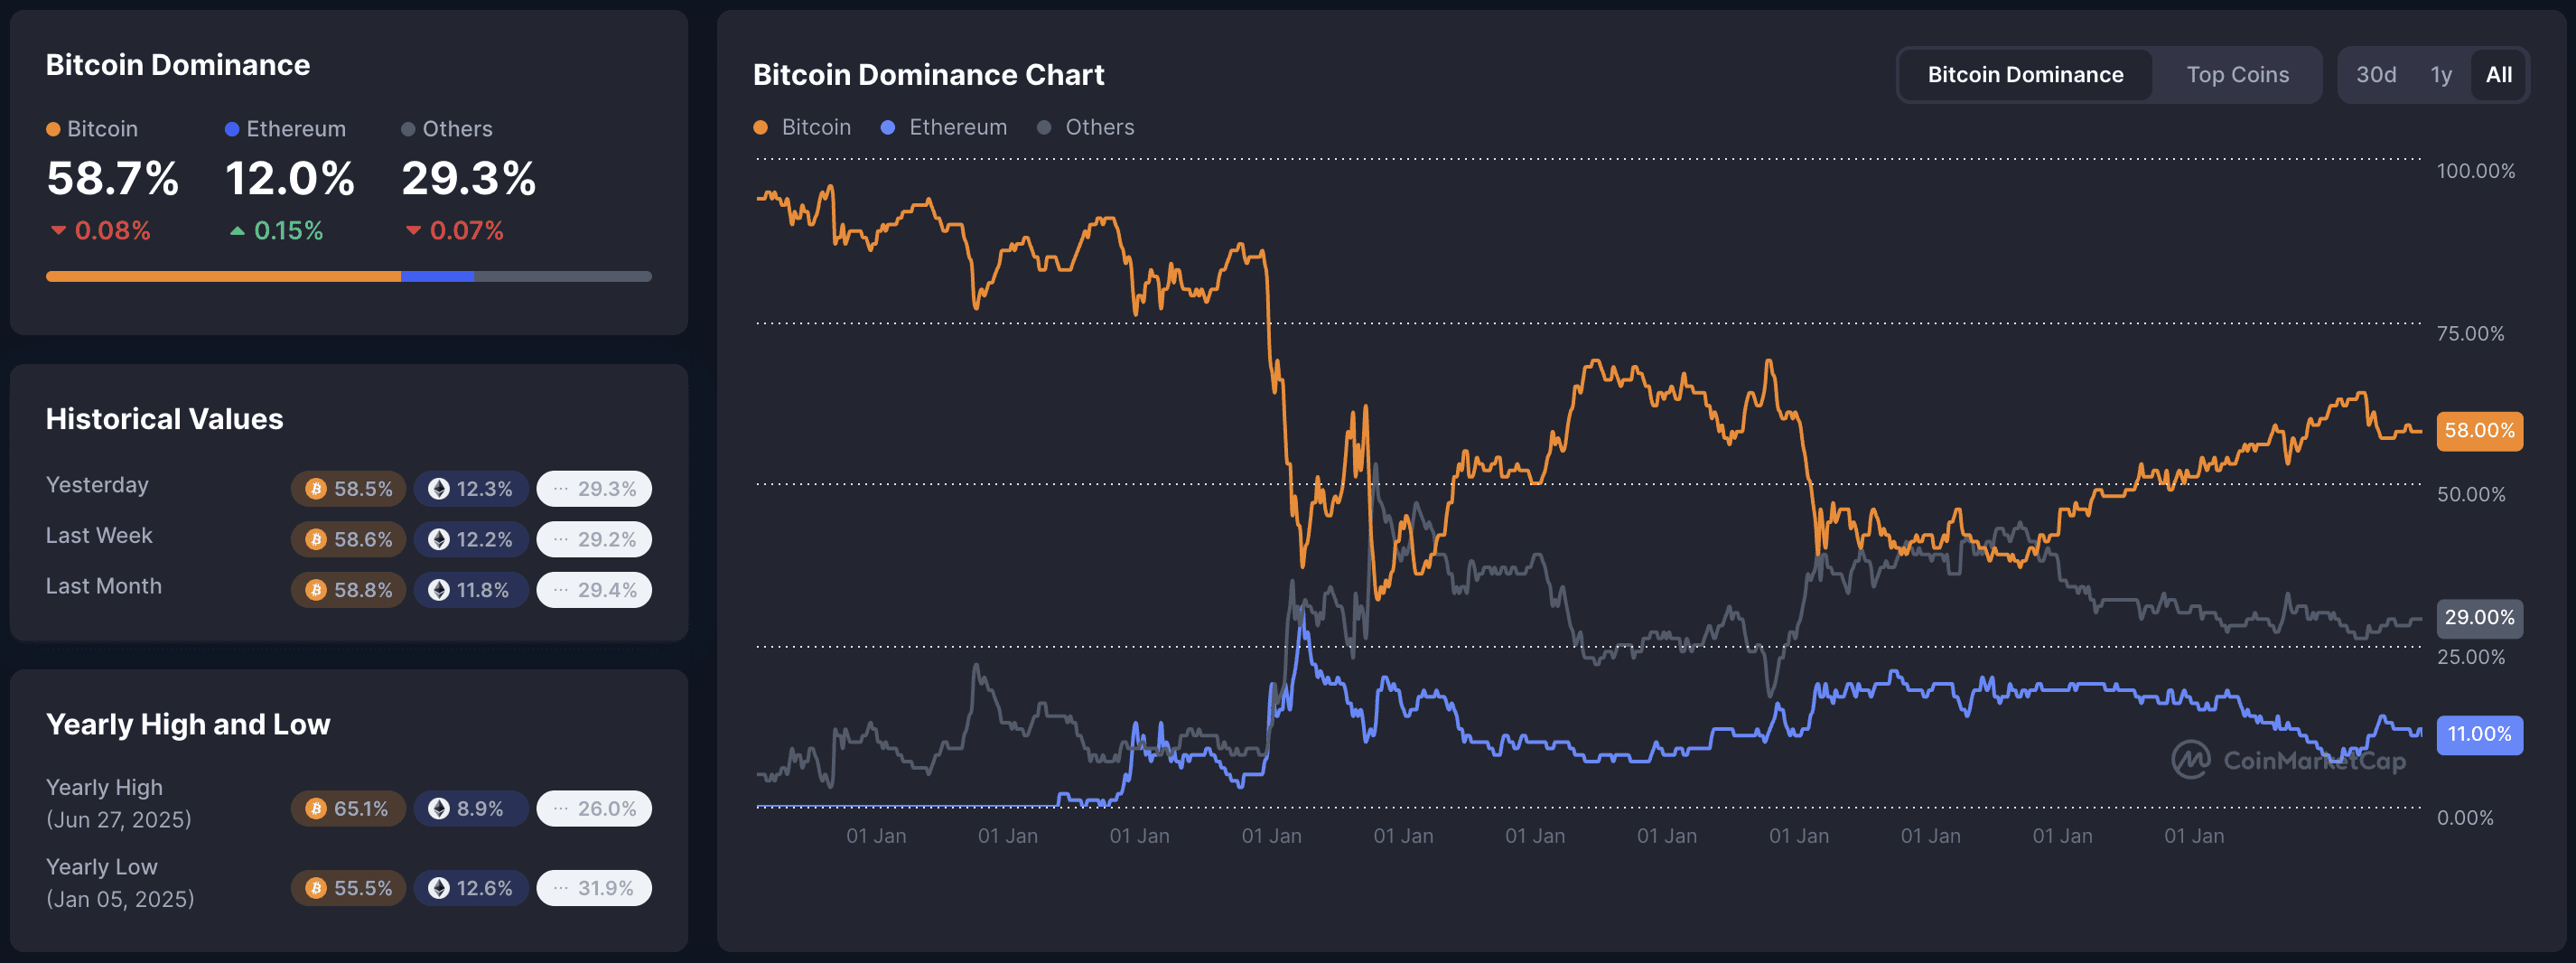
How to read trends? Check volume and on-chain for confirmation. High dominance often means consolidation before a bull run.
🚀 Quick Hits
Bitcoin dipped below $86K, testing November lows on thin liquidity and Japan economic woes.
XRP ETFs saw +$11M inflows, total net ~$1B since November launch despite market bleed.
BTC active addresses at 12-month low, hinting at reduced network activity.
Tron leads yearly gainers +22% YTD on stablecoin dominance.
Crypto stocks like MicroStrategy down -4%, but MSTR bought ~$1B BTC last week.
Global risk-off from Japan economy and slower Fed cuts adds pressure on assets.
P.S. 4-6 min read. Free daily alpha. Unsubscribe anytime. © Web Snack 2025.
This newsletter is for informational purposes only and does not constitute investment advice. Always conduct your own research and make independent decisions.
