Crypto sold off hard as tech rolled over and gold hit fresh highs. BTC broke down, ETF flows worsened, and alt liquidity thinned fast.

🍪 Today's Snack
Crypto got hit by a broad risk-off wave as tech rolled over, Bitcoin broke lower, and gold printed fresh highs. It was a classic “sell what you can” session.
📈 24h Crypto Market Snapshot
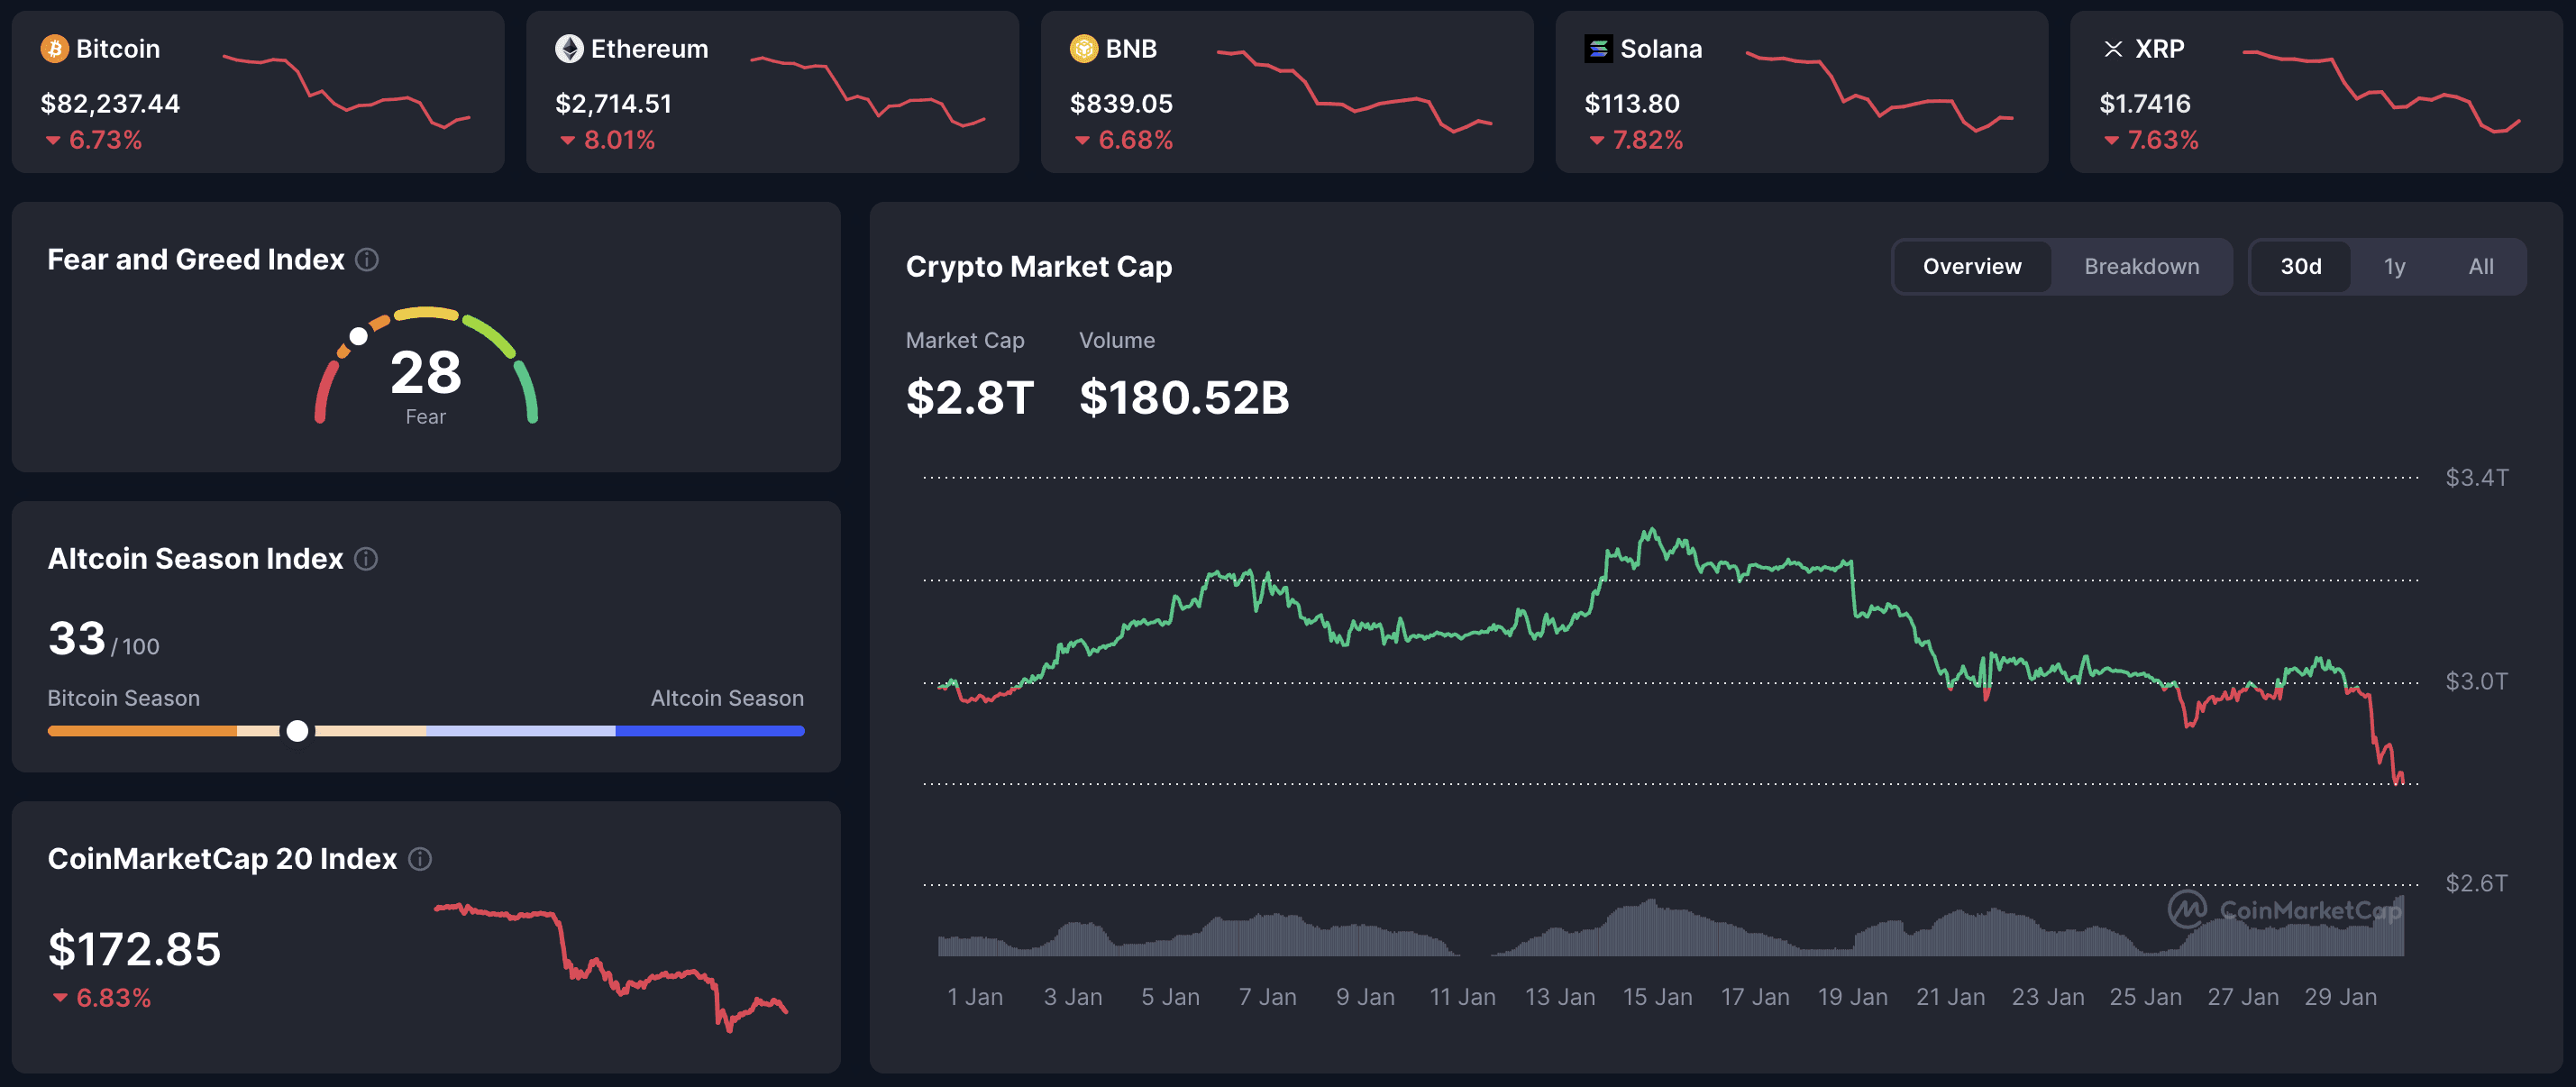
Total crypto market cap fell to $2.8T while Fear & Greed dropped to 28 (Fear), with majors selling off in sync.
Asset | Price (USD) | 24h Change | Market Cap |
|---|---|---|---|
BTC | $82,237 | -6.73% | $1.64T |
ETH | $2,714 | -8.01% | $327B |
BNB | $839 | -6.68% | $114B |
SOL | $113 | -7.82% | $64B |
HYP | $28 | -11.67% | $8.7B |
Selloff – fast de-risking as “tech rout + BTC crash + gold ATH” dominated the tape.
🔥 Top 3 Movers & Shakers
Canton (CC) – +6.8%
CC hit an all-time high of $0.179–$0.181 on January 29, extending momentum tied to its DTCC partnership narrative and Canton Network validator news, with activity cited at 700,000 daily transactions and $9T monthly volume routed through validators.
Takeaway: Rare TradFi validation can overpower a weak market, but governance, regulation, and overbought signals make pullbacks likely.Mantle (MNT) – -12.6%
Mantle slid to around $0.89 on January 29 and is down 52.74% over three months, with no single catalyst beyond continued L2 underperformance and dilution concerns (32.5% circulating supply).
Takeaway: Low fees and unlock overhang keep L2 tokens in a tough spot, and this still looks like a downtrend without a near catalyst.Moonbirds (BIRB) – -28%
BIRB dumped after its January 28 TGE and January 29 claims opening, with post-claim selling pushing price from $0.31+ toward $0.25 amid early liquidity across major venues.
Takeaway: This reads like a textbook post-TGE distribution event, where initial hype fades once supply hits the market.
🏦 ETF & Institutional Flows
Bitcoin spot ETFs recorded $817M in net outflows, while Ethereum ETFs saw $155M outflows.
Flow read: Risk-off accelerates – Bitcoin outflows stayed heavy while Ethereum attracted some capital, but overall conviction looked fragile amid the liquidation-driven selloff.
🌍 Market Context (Macro + On-Chain)
Macro Pulse: A tech rout followed Microsoft’s earnings, while precious metals ripped to new highs as the “hard assets first” trade strengthened. Regulatory progress was mixed: the Senate Agriculture Committee advanced the Clarity Act 12–11, but it still faces a Banking Committee hurdle.
On-Chain Highlights: Exchange reserves were relatively stable despite the crash (about 1,200 BTC net inflows, ~0.04%), suggesting the move was more leverage-driven than spot capitulation. At the same time, ERC-20 stablecoin supply has been draining, implying less fresh buy-side liquidity on-chain.
🔍 Deep Dive – “Digital gold” failed the perfect test
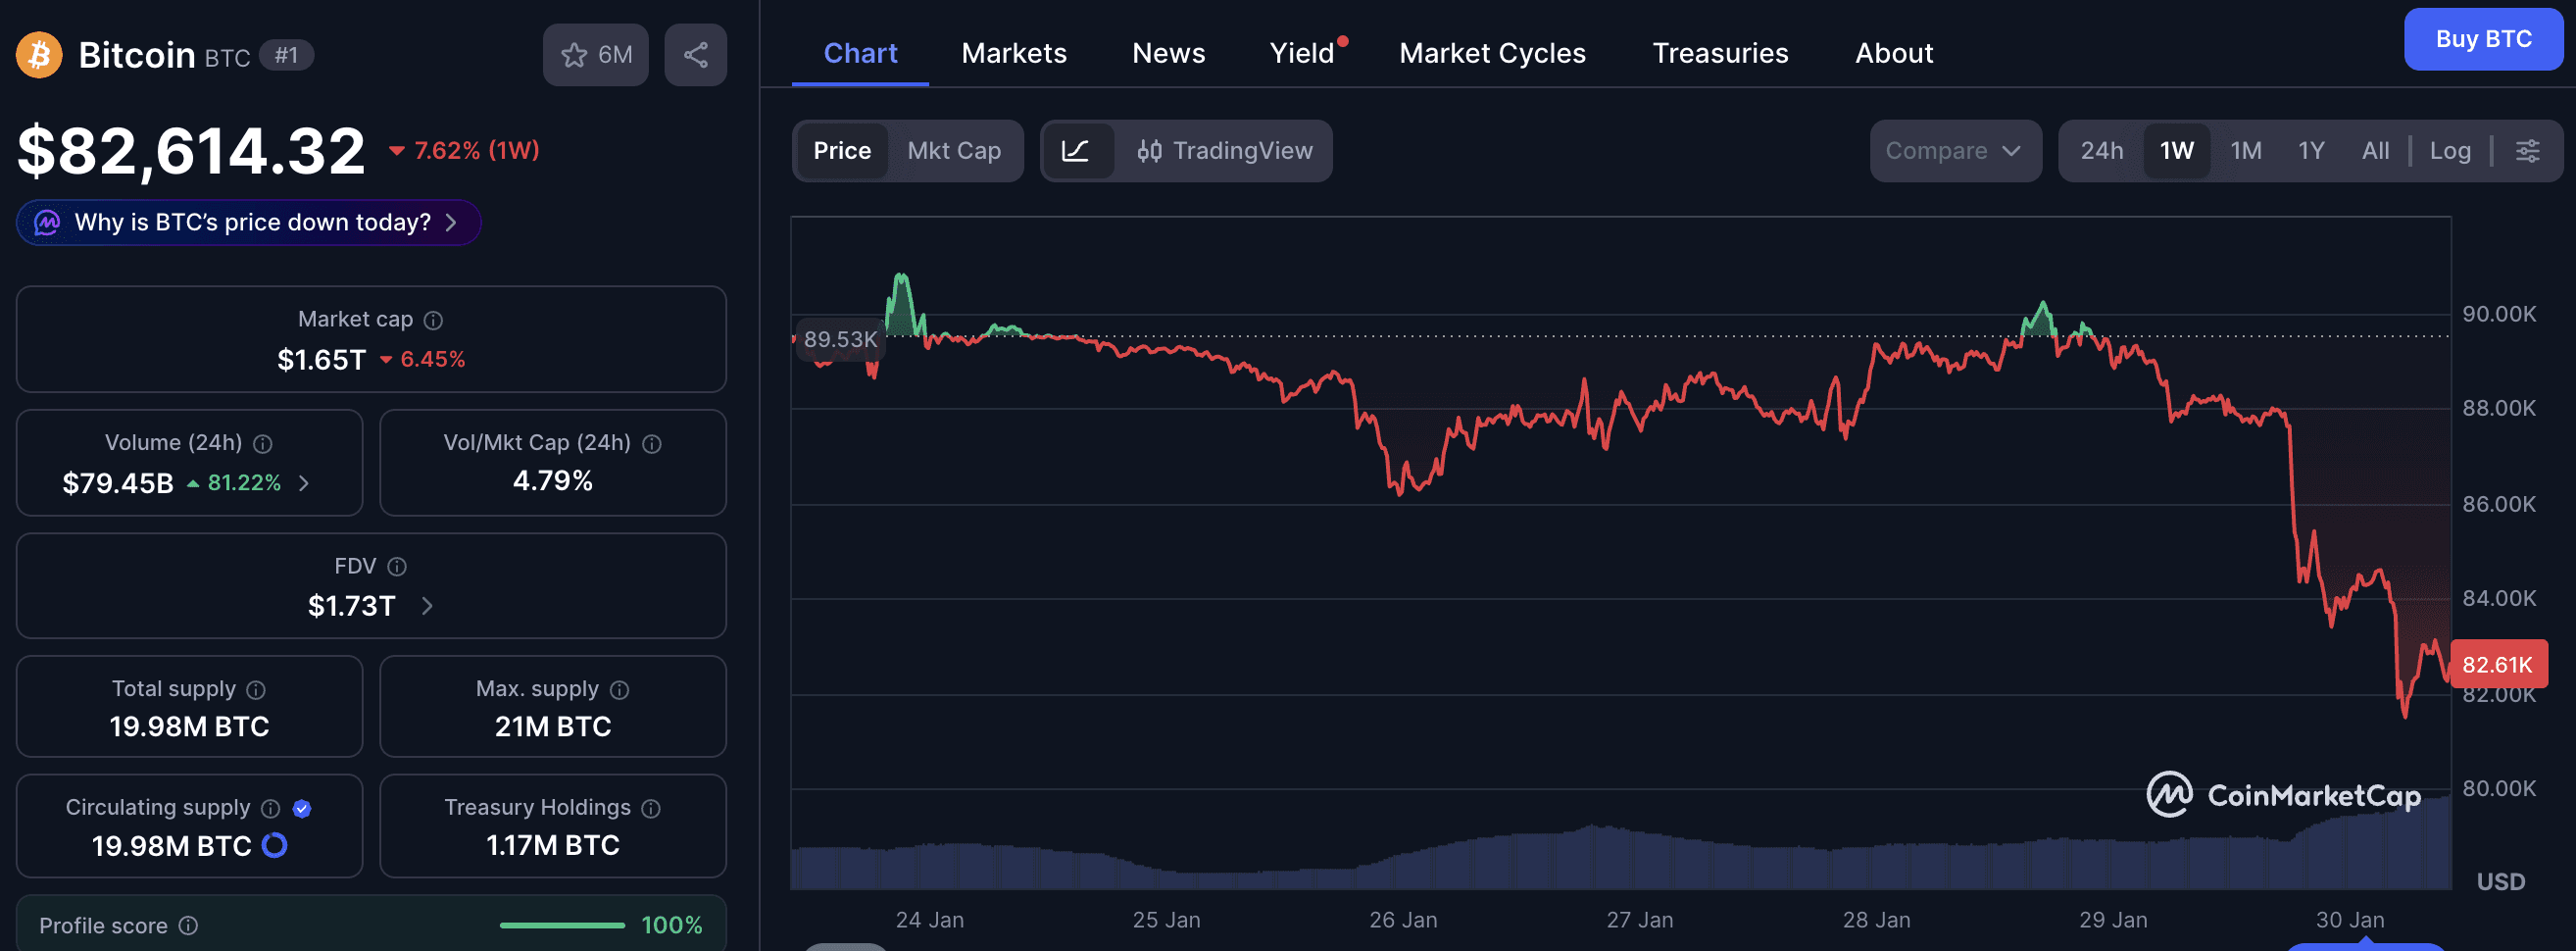
January 29 was a brutal reality check for the “digital gold” story. Bitcoin dropped to $83,383 (a two-month low and -33.7% from the October 2025 ATH of $126,198) while gold surged to $5,595.47/oz and silver hit $121.79, with DXY down at 96.19.
The plumbing told the same story: spot Bitcoin ETFs saw $160.17M in weekly outflows through January 28, following the prior week’s $1.33B, bringing two-week outflows to $1.49B, while ERC-20 stablecoin supply fell $7B (from $162B to $155B). When capital fled, it didn’t rotate neatly into BTC – it exited the complex.
The selloff also looked mechanically amplified. Over $1B in positions were liquidated in 24 hours, with $768M from Bitcoin futures and 96.96% of those BTC liquidations coming from longs, as volatility spiked above 40.
What it suggests: In a high-stress macro setup, Bitcoin still trades more like leveraged risk than crisis insurance, while the safe-haven premium keeps flowing to physical metals.
📰 Top News
Bitcoin: BTC fell to $83,383 on January 29 as risk-off and liquidations overwhelmed the weak-dollar narrative.
Crypto market: Broad weakness hit the complex as most large tokens moved lower in sync.
DeFi: TVL stabilized around $130–$140B, still far below the $237B peak despite an early-January bounce.
ETFs: Bitcoin ETFs saw a massive outflow day while Ethereum ETFs flipped negative after a brief inflow streak.
📚 Education Bits
💡 Pro Tip: On crash days, separate spot selling from leverage unwinds – liquidations can drive huge candles without matching exchange deposit spikes.
📊 Metric Explained: Exchange reserve changes are a quick proxy for panic: big reserve jumps often mean spot holders are preparing to sell, while flat reserves can imply futures-driven damage.
📊 Daily Wrap-Up
This was a full risk-off flush: majors broke lower together, liquidity thinned, and the market paid for leveraged positioning. The bigger tell is the divergence – gold absorbed the safe-haven bid while BTC struggled to hold the “digital gold” line.
Today's Watch List: Watch whether BTC stabilizes after the liquidation wave, and whether stablecoin supply keeps contracting or finally levels off.
Read more on websnack.org – free daily alpha in under 5 minutes.
P.S. 4-6 min read. Free daily alpha. Unsubscribe anytime.
© Web Snack 2026.
This newsletter is for informational purposes only and does not constitute investment advice. Always conduct your own research and make independent decisions.
