The CMC and alternative.me indices use different data and regularly disagree. What each measures, when they diverge, and how to use both

Don't scroll Twitter for crypto news
One email. Five minutes. Everything that matters today
The crypto fear and greed index compresses the emotional state of the cryptocurrency market into a single daily number between 0 and 100. Two versions are in active use: alternative.me's Crypto Fear and Greed Index, which has tracked Bitcoin sentiment since February 2018, and CoinMarketCap's CMC Fear and Greed Index, launched in August 2023. They share a scale and a name. Their methodologies measure different things, and they regularly disagree.
Web Snack tracks both the CMC and alternative.me Fear and Greed Index in every daily issue. Subscribe to get the number with context before the market opens.
Why the Fear and Greed Index Became the Most-Checked Sentiment Number in Crypto
The concept originates with CNN's stock market Fear and Greed Index, which measures equity sentiment using seven traditional financial signals: price momentum, stock breadth, put/call ratios, junk bond demand, market volatility via the VIX, safe-haven demand, and stock price strength. Alternative.me adapted it for crypto in February 2018, stripping out the bond-market inputs that have no equivalent in digital assets and replacing them with Bitcoin volatility, Twitter activity, and Google Trends data.
The timing mattered. 2018 was Bitcoin's first major post-ATH crash cycle. Retail investors who had entered near the December 2017 peak watched prices fall for months with no framework for understanding whether they were near the bottom or halfway through. A daily number that said "Extreme Fear: 12" gave some structure to what was otherwise just a red chart. The index spread on crypto Twitter and became a daily ritual for investors who want one number to anchor their read of where sentiment stands.
By the 2020 to 2022 bull cycle, media coverage of extreme greed readings had turned the index into a partial self-fulfilling indicator. Bloomberg and Reuters cited it regularly. A reading of 88 or 90 generated headlines. Retail buyers followed the coverage. The index climbed further. November 2021 is the clearest example: the alternative.me index hit 84 on November 9, and Bitcoin reached its all-time high of approximately $69,000 the following day. The index did not predict the top. It reflected the conditions in which tops form.
How the CMC Fear and Greed Index Works and What Makes It Different by Design
The CMC Fear and Greed Index measures sentiment across the top 10 cryptocurrencies by market capitalization, excluding stablecoins. CoinMarketCap launched it on August 3, 2023, with an explicit rationale: every existing crypto fear and greed index tracked only Bitcoin, while CoinMarketCap listed more than 20,000 tokens. A Bitcoin-only gauge could not measure the broader market.
Four of its five components are publicly documented. Price Momentum tracks the recent performance of the top 10 cryptos relative to each other and the broader market. Volatility uses the Volmex Implied Volatility Indices: BVIV for Bitcoin and EVIV for Ethereum (forward-looking measures of expected price movement over the next 30 days, derived from options pricing rather than historical price comparisons). The Derivatives Market component uses the put/call ratio in Bitcoin and Ethereum options markets (the ratio of bearish put contracts to bullish call contracts; a rising ratio means traders are positioning for a decline). Market Composition uses the Stablecoin Supply Ratio, or SSR (the ratio of Bitcoin's market cap to the aggregate market cap of major stablecoins; money in BTC rather than stablecoins signals confidence). The fifth component has not been disclosed.
Individual component weights are also unpublished. Alternative.me documents every weight explicitly: volatility at 25%, market momentum at 25%, social media at 15%, Bitcoin dominance at 10%, Google Trends at 10%, and surveys at 15%, though the survey component has been paused indefinitely and does not run in the live index. CMC's weighting is proprietary. The CMC index produces a reading with no way to trace which inputs drove it.
The forward-looking volatility input is the sharpest structural difference between the two. Alternative.me looks back at what Bitcoin's price did relative to the past 30 and 90 days. CMC looks forward at what options markets are pricing for the next 30 days. One measures how retail investors behaved in the past. The other reflects where professional traders are putting money right now.
CMC vs. Alternative.me Fear and Greed Index: What the Methodology Comparison Actually Shows
The CMC Fear and Greed Index differs from alternative.me in two structural ways: the scope of assets it covers, and the type of data it uses.
alternative.me CFGI | CMC Fear and Greed Index | |
|---|---|---|
Launched | February 2018 | August 2023 |
Scope | Bitcoin-focused | Top 10 cryptos, excl. stablecoins |
Volatility input | Historical (30/90-day BTC price averages) | Forward-looking (Volmex BVIV/EVIV) |
Social and search data | Twitter hashtags, Google Trends, BTC dominance | Not included |
Derivatives data | Not included | Put/call ratio (BTC and ETH options) |
Component weights | Fully published | Not disclosed |
Survey component | Paused (was 15% of model) | N/A |
Alternative.me is Bitcoin-centric and retail-facing. All active inputs are public and backward-looking: Bitcoin price history, Twitter hashtag volume, Bitcoin dominance within the total crypto market cap, and Google searches for Bitcoin-related terms. CMC uses data types that retail investors rarely look at directly. The put/call ratio and the Volmex implied volatility indices are tracked primarily by professional traders and institutions.
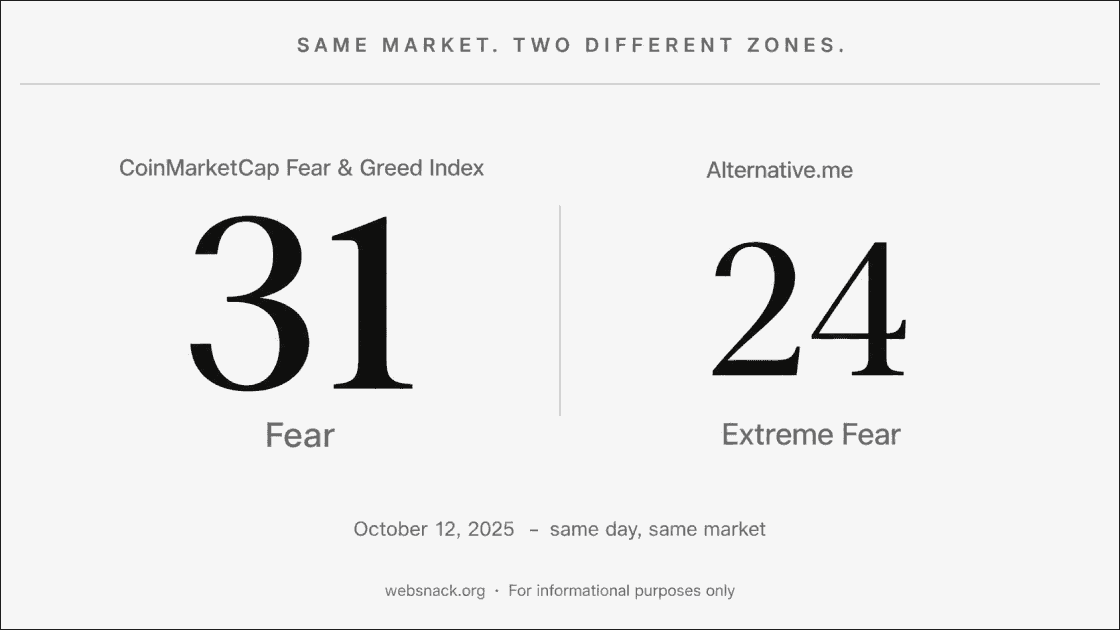
The two indices diverge regularly as a result. On October 12, 2025, alternative.me read 24 (Extreme Fear) while the CMC index read 31 (Fear). Same market, same moment, different zone classifications. A retail investor checking only alternative.me saw Extreme Fear. One checking CMC saw standard Fear. When the two readings diverge by a meaningful margin, the gap itself carries information. CMC reading higher than alternative.me means institutional derivatives positioning is less bearish than Bitcoin-centric retail sentiment suggests. CMC reading lower means options markets are pricing in more downside than the Bitcoin price chart and social data currently show.
What Extreme Fear Actually Predicts and Where the Signal Breaks Down
Extreme fear is a reading below 25. Since alternative.me launched in February 2018, readings below 10 have occurred during only a handful of distinct market crises, and the return data from those periods points consistently in one direction.
Available historical data shows Bitcoin's median 90-day return following a sub-10 reading at approximately +48.5%. Every sub-10 reading on record has produced positive 12-month returns. On a 12-month horizon, extreme fear has been a reliable contrarian signal.
The 30-day picture is different. After the Terra/Luna collapse pushed the index to 6 in June 2022, Bitcoin fell further before finding its November 2022 low of approximately $15,600. Someone who bought on the first sub-10 reading sat through five months of additional losses. The index correctly identified that sentiment was at an extreme. It contained no information about how much further prices would fall before the recovery began.
The early 2026 streak was different from everything before it. From late February through April 2026, the index spent more than 60 consecutive days below 10, the longest streak on record, double the previous high. The catalyst was not a crypto-native collapse. No exchange failed, no major protocol imploded. The fear came from US tariff escalation and global macro uncertainty. During the same period, spot Bitcoin ETF inflows reached $1.5 billion in March 2026 alone, with BlackRock's IBIT recording seven consecutive inflow days from March 9 to 17, totaling $1.17 billion. Institutions were buying while the retail sentiment gauge showed its worst reading ever.
That split between historic fear on alternative.me and institutional buying in the ETF market is invisible if you are reading only one index.
How to Use the Fear and Greed Index Without Mistaking Sentiment for a Signal
The index is a context layer, not a trigger. A reading of 12 does not tell you to buy. It tells you that the conditions in which buying has historically produced outsized long-term returns are currently present. What you do with that depends on your time horizon and everything else in your analysis.
Reading CMC and alternative.me together adds one dimension that neither provides alone: the gap between institutional positioning and retail sentiment. When the two are close together, sentiment is consistent across participant types. When they diverge, the direction of the gap matters. CMC reading higher than alternative.me typically means derivatives markets are less concerned than social sentiment suggests. CMC reading lower means professional traders are positioning more defensively than the Bitcoin price chart implies.
Two limitations apply to both indices. Both update once per day. During fast-moving events, the daily reading lags actual market conditions by up to 24 hours. And alternative.me's survey component, originally 15% of the model, has been paused indefinitely. Most coverage still describes the index as a six-component model, but the live version runs on five inputs. CoinMarketCap has never disclosed the individual weights of any CMC component, and the fifth component is unnamed. Both numbers are useful approximations of sentiment. Neither is a precise measurement of anything.
Bitcoin crossed $80,000 in early May 2026. The historical 90-day pattern held. The index, as always, was right about the direction and uninformative about the timing.
The CMC Fear and Greed Index reading appears in every Web Snack daily issue alongside the key market numbers. Subscribe to track it with full context.
This article is for informational purposes only and does not constitute investment advice. Always conduct your own research before making any financial decisions.
Like this story? There's more tomorrow
Join Web Snack – no fluff, just value