Price tells you what already happened. These five on-chain metrics tell you what's happening now, with current data and free tools to access every chart

Don't scroll Twitter for crypto news
One email. Five minutes. Everything that matters today
On-chain metrics pull data directly from blockchain ledgers: wallet movements, transaction flows, and holding patterns that every crypto transaction leaves behind. Unlike price charts, they reflect what participants are actually doing with their assets, not what the market believes they're worth. Five charts give crypto investors a structured way to read conditions before they appear in price: MVRV ratio, exchange reserves, stablecoin supply, active addresses, and total value locked.
Track these 5 charts before your next trade. The data is free. Subscribe to Web Snack for the weekly breakdown that matters.
Why On-Chain Data Gives Crypto Investors an Edge Over Price Charts
On-chain data is public by design. Every Bitcoin transaction lands on a permanent, transparent ledger accessible to any investor who knows which tools to check. Glassnode, CryptoQuant, and DefiLlama translate that raw data into readable charts at no cost on their standard tiers.
Price charts answer one question: what did the market pay? On-chain data answers a different one: what are holders doing right now? A coin's price tells you nothing about whether people are moving it to exchanges to sell, withdrawing it to cold storage, or minting fresh stablecoins as dry powder. Price is the outcome. On-chain is the behavior.
That distinction matters more now. Spot Bitcoin ETFs, approved by the SEC on January 10, 2024, created an institutional demand layer that flows directly through on-chain infrastructure. ETF custodians collectively hold approximately 1.5 million BTC, roughly 7.1% of Bitcoin's maximum supply of 21 million coins. Every ETF purchase appears in the same blockchain data these five metrics track.
MVRV Ratio: How to Read Bitcoin's Valuation From the Blockchain
The MVRV ratio is the ratio between Bitcoin's market capitalization and its realized capitalization. Market cap is the familiar figure: price multiplied by coins in circulation. Realized cap is different. It values each coin at the price it last moved on-chain. That gives the entire Bitcoin network an aggregate on-chain cost basis. Divide market cap by realized cap and the result shows how far the current price sits above or below what the average holder paid.
Created by Murad Mahmudov and David Puell in October 2018, MVRV has a documented track record across multiple Bitcoin cycles. A reading above 1.0 means the average holder is in profit. Below 1.0, the average holder is underwater. That sub-1.0 zone appeared on roughly 15% of all trading days since 2017, per Glassnode, and historically coincided with cycle bottoms. A reading above 3.2 marked overheated territory. That threshold appeared on only 6% of historical trading days. Every confirmed breach above 3.2 preceded a major correction.
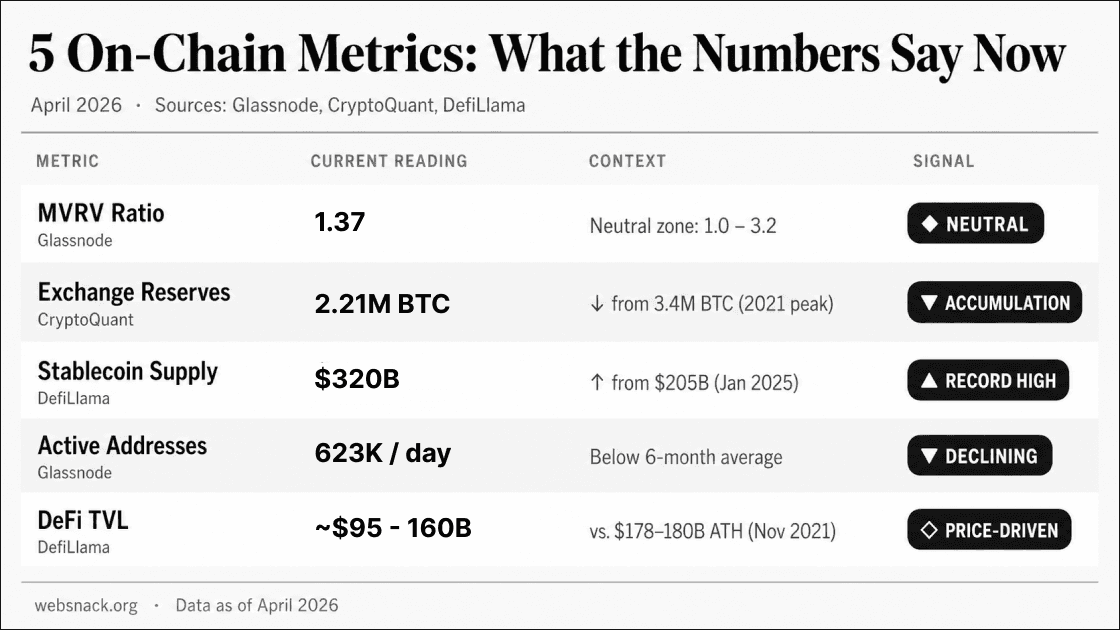
As of April 14, 2026, MVRV stood at 1.37, per Glassnode data compiled by OurCryptoTalk. By early May 2026, Bitcoin had crossed above the network's realized price of approximately $78,200, per Glassnode's Week-on-Chain report. That put the ratio near 1.0. For a first reading: 1.0 is the break-even level for the average holder, and 3.2 is the historical overvaluation boundary. Readings between those levels are positioning signals, not trade signals.
Metric | What it measures | Rising means | Falling means | Free tool |
|---|---|---|---|---|
MVRV Ratio | Average holder's unrealized profit/loss | Overheating | Undervaluation or accumulation | |
Exchange Reserves | BTC available to sell on exchanges | Sell pressure building | Accumulation, cold storage, ETF absorption | |
Stablecoin Supply | Total fiat capital on crypto rails | Fresh capital entering | Capital exiting to fiat | |
Active Addresses | Daily network participation | Growing engagement | Reduced retail activity | |
TVL | Capital deposited in DeFi contracts | DeFi usage growing | Capital or users leaving DeFi |
What Falling Bitcoin Exchange Reserves Signal About Market Supply
Exchange reserves measure how much Bitcoin sits on centralized trading platforms, immediately available to be sold. Coins on exchanges represent the market's live sell-side float. When investors move coins onto an exchange, they are typically preparing to sell or trade. When they withdraw to a personal wallet, they are choosing to hold.
Bitcoin exchange reserves dropped to approximately 2.21 million BTC by late April 2026, a 7-to-9-year low per CryptoQuant. That is down from roughly 3.4 million BTC at the 2021-2022 cycle peak, a reduction of approximately 780,000 BTC over four years. Three destinations absorbed the outflows: personal cold storage wallets (FTX's collapse in November 2022 permanently accelerated self-custody adoption), ETF custodians now holding approximately 1.5 million BTC collectively, and corporate treasury accounts. In the 30 days through late April 2026, exchanges saw net outflows of approximately 48,500 BTC worth $3.6 billion.
Reserve figures vary between providers. CoinGlass tracked 2.43 million BTC in mid-April 2026; CryptoQuant reported 2.21 million BTC the same week, a gap of roughly 220,000 coins. The platforms identify exchange-controlled wallets using different methodologies, and internal exchange reshuffles sometimes appear as outflows. The directional trend is consistent across providers. Any precise figure from a single source should be treated with that in mind.
Stablecoin Supply: Crypto's Most Reliable Capital Inflow Indicator
Stablecoin supply is the total dollar value of all fiat-pegged tokens in circulation across all blockchains. Minting a new USDT or USDC requires depositing real dollars with the issuer. Every net increase represents fresh fiat capital entering crypto rails. That makes stablecoin supply the most direct on-chain proxy for new money flowing into the ecosystem.
Total stablecoin supply crossed $320 billion on April 16, 2026, per DefiLlama, up from approximately $205 billion at the start of 2025. That is a $115 billion increase in 16 months, faster than both 2023 (down $7 billion) and 2024 (up $70 billion). Stablecoins accounted for 75% of all crypto trading volume in Q1 2026, the highest share on record per CEX.IO. Quarterly transaction volume reached $28 trillion. That exceeded Visa and Mastercard combined.
The USDC-USDT split inside that headline is the more specific signal. USDC supply grew $4.5 billion through Q1 2026 while USDT declined approximately $2 billion, a $6.5 billion relative shift in three months per Artemis data. An EY-Parthenon and Coinbase survey of 351 institutional investors conducted in January 2026 found 86% using or holding USDC compared to 68% for USDT, after the passage of the U.S. GENIUS Act in July 2025 established a federal regulatory framework for compliant stablecoin issuers. Circle's next quarterly attestation will show whether the gap is widening.
Active Addresses and TVL: What Network Data Actually Reveals
Active addresses count the number of unique blockchain addresses that sent or received a successful transaction on a given day. A rising count signals growing network participation. A falling count typically means holders are stepping back from active trading. Bitcoin daily active addresses averaged 623,382 in Q2 2026, below the 6-month average per Glassnode, consistent with reduced retail engagement at current price levels.
That number requires one correction before you act on it. An address is not a user. One investor can control hundreds of wallets. A single exchange address can represent millions of customers. Glassnode's own documentation states that using raw address counts as user proxies is "fallacious." The metric reliably tracks directional trends over time, whether a network is becoming more or less active. Actual participant counts require entity-adjusted metrics, available on Glassnode's free tier.
TVL, or total value locked, measures the dollar value of crypto assets deposited in DeFi protocol smart contracts (lending pools, liquidity provision, and yield strategies). Ethereum holds $57.23 billion in TVL as of April 17, 2026, approximately half of global DeFi's total per DefiLlama. The metric has one structural flaw: it is denominated in dollars and inflates automatically when token prices rise, even without new capital entering. In February 2026, DeFi TVL fell 12% from $120 billion to $105 billion while 1.6 million ETH was actively added. Price drove the decline, not capital exit. For DeFi protocol research, the market capitalization to TVL ratio is a more reliable starting point than the raw number alone.
How to Read On-Chain Data When Multiple Signals Align
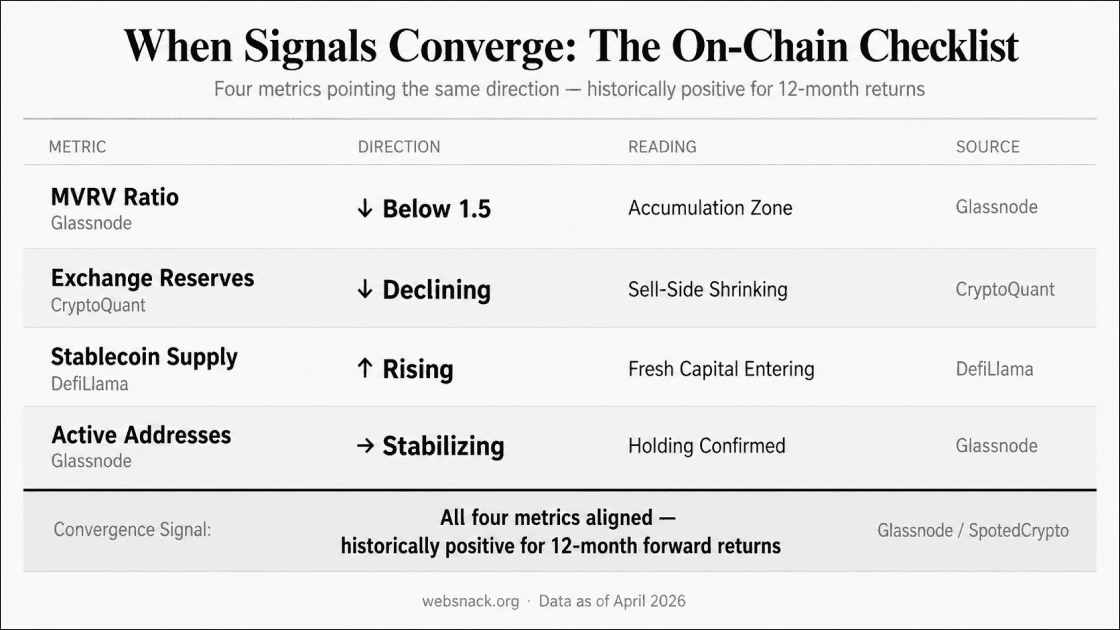
No single on-chain metric tells the full story. CryptoQuant Head of Research Julio Moreno stated in April 2026 that Bitcoin remained in a bear market that could extend through Q3 2026, even as exchange reserves sat at a 7-year low and stablecoin supply set a record high. MVRV can sit in an accumulation zone for months before price recovers. On-chain data describes what participants are doing. It does not predict what price will do next.
The reading gets sharper when multiple metrics converge. Every instance since 2013 in which Bitcoin's MVRV entered the 1.0-1.5 zone and a subsequent recovery occurred produced positive 12-month returns, seven out of seven, according to SpotedCrypto's analysis of Glassnode data. That is a historical pattern, not a guarantee. Macro conditions, leverage levels, and regulatory developments affect timing independently of any on-chain position.
Two data points are worth watching in particular. Stablecoin supply reaching $350 billion would indicate a capital wave meaningfully above the April 2026 record. Exchange reserves nearing 2 million BTC would mark a supply threshold with no modern precedent. The OCC and other primary federal payment stablecoin regulators must issue implementing regulations by July 18, 2026 under the GENIUS Act. That outcome will affect USDT and USDC issuance rates directly, and the capital inflow signal stablecoin supply provides along with them.
Stablecoin flows, exchange reserves, and MVRV in one weekly read. Subscribe to Web Snack.
This article is for informational purposes only and does not constitute investment advice. Always conduct your own research before making any financial decisions.
Like this story? There's more tomorrow
Join Web Snack – no fluff, just value