Crypto market extends digestion with broader pullback: total cap at $3.1T, Bitcoin down -2.5% to ~$90.5K on increased selling pressure...

🍪 Today’s Snack
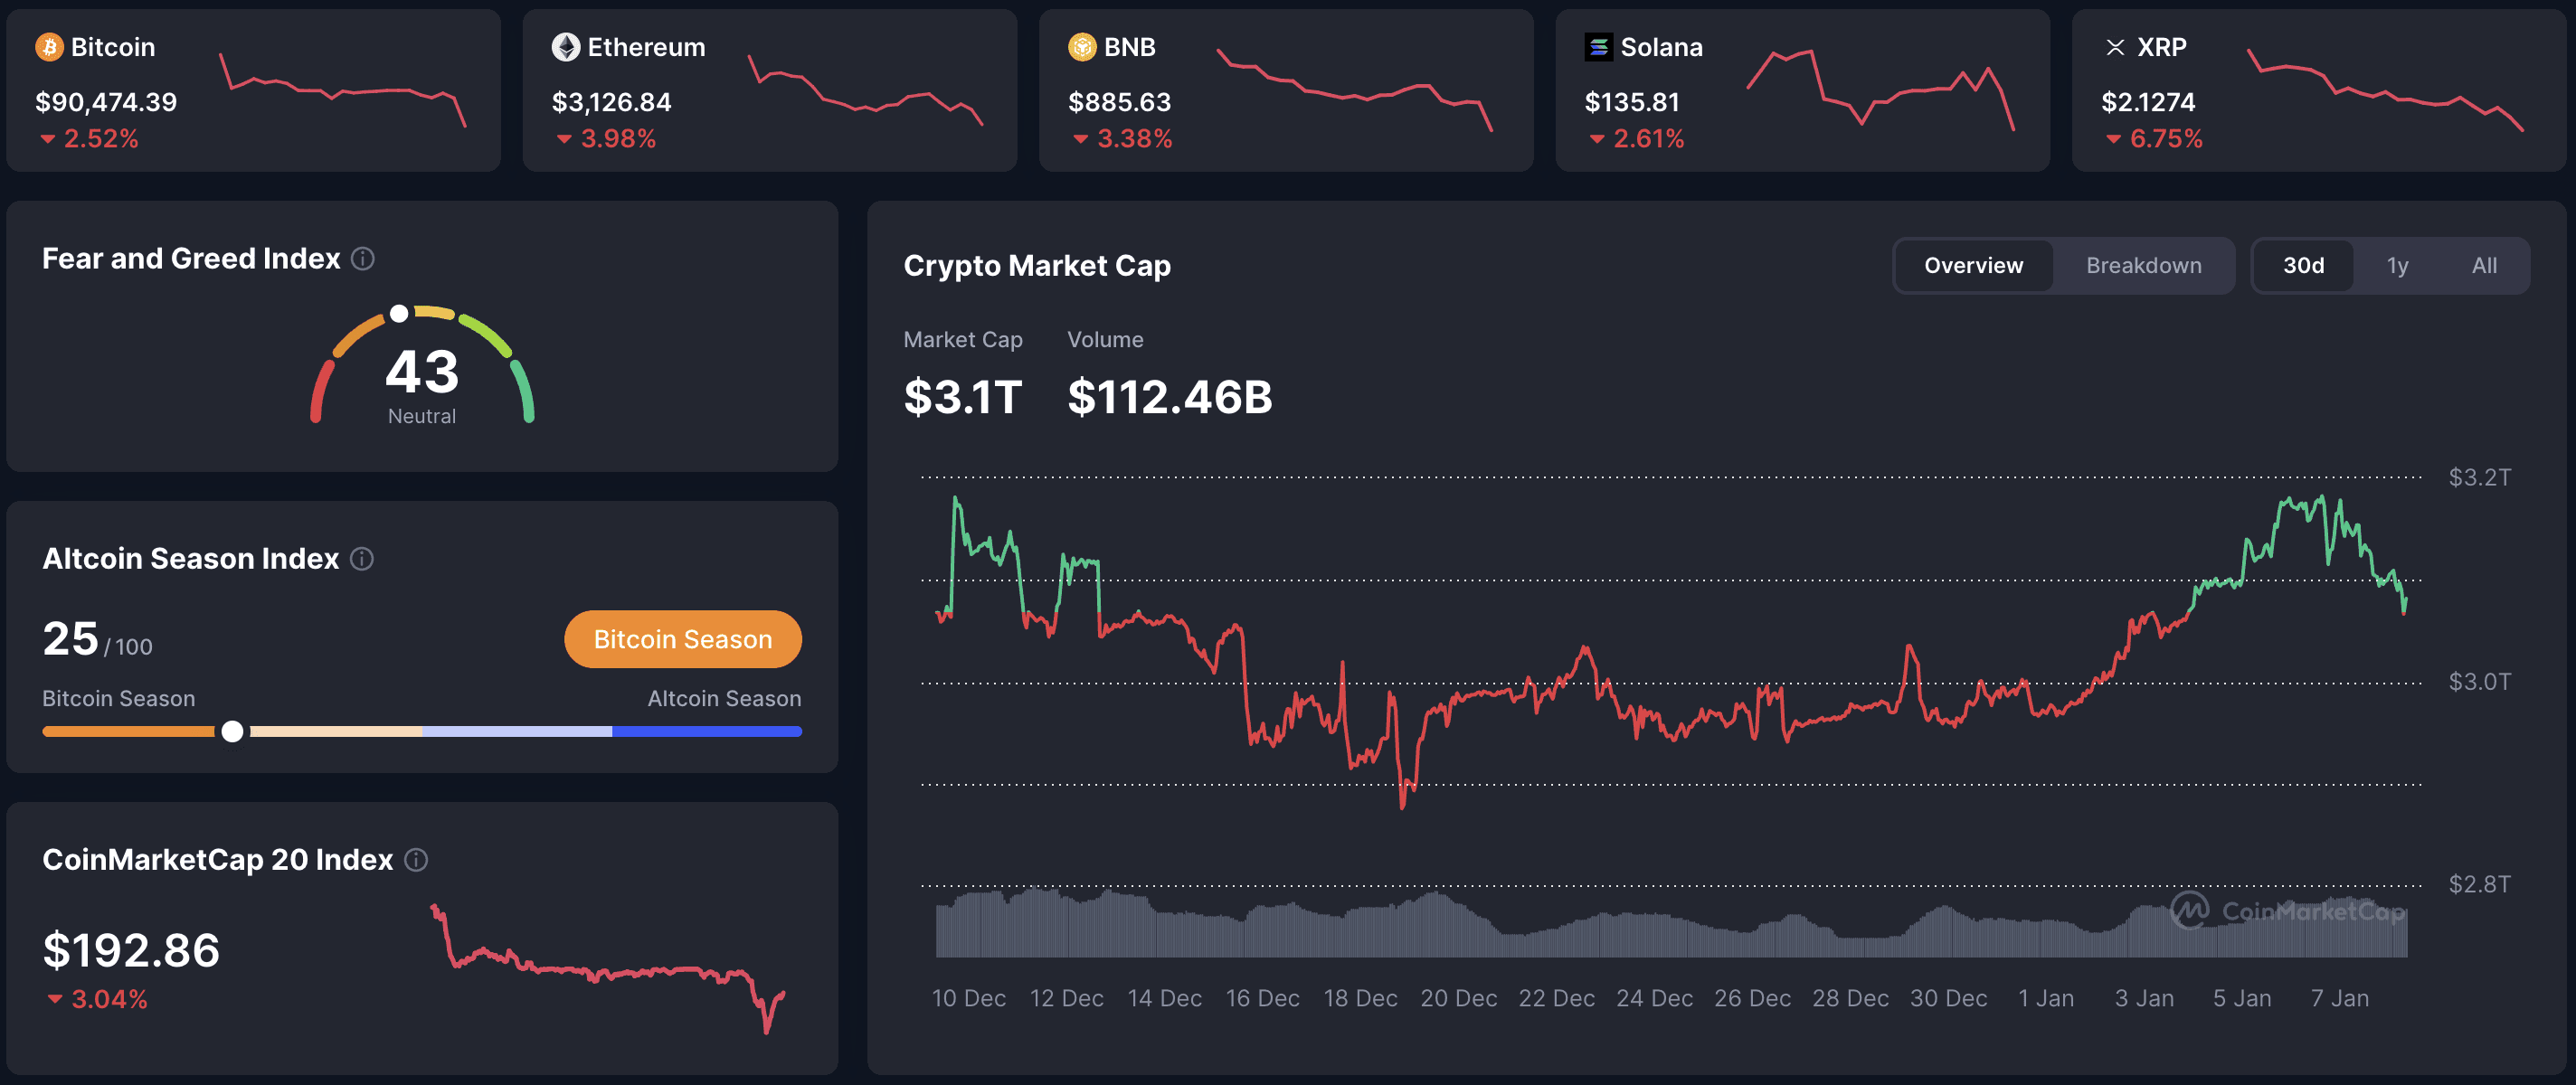
Crypto market extends digestion with broader pullback: total cap at $3.1T, Bitcoin down -2.5% to ~$90.5K on increased selling pressure, while ETF outflows accelerate and select privacy/utility tokens buck the trend.
📈 24h Crypto Market Snapshot
Total cryptocurrency market cap stands at $3.1T (-~1.2% over 24h per CoinMarketCap). The Fear & Greed Index is at 43 (Neutral), reflecting balanced sentiment after holiday-driven moves.
Asset | Price (USD) | 24h Change | Market Cap (USD) |
|---|---|---|---|
BTC | $90,474 | -2.52% | $1.80T |
ETH | $3,126 | -3.98% | $376B |
BNB | $885 | -3.38% | $121B |
XRP | $2.12 | -6.75% | $128B |
SOL | $135 | -2.61% | $76B |
ADA | $0.393 | -5.73% | $14.1B |
How to interpret sentiment dips? Drops into neutral often highlight overextension - use with volatility metrics to spot reversal points.
🔥 Top 3 Movers & Shakers
LEO Token (LEO) - +1.7%: Exchange utility token resists downturn on steady platform flows and tokenomics.
Takeaway: Resilient utilities signal safe havens - monitor exchange reserves for broader trends.
Canton (CC) - +1.4%: Privacy coin edges higher amid rotation to defensive narratives.
Takeaway: Privacy assets decouple in volatility - track adoption metrics like active addresses.
sUSDS (sUSDS) - +0.9%: Yield-stablecoin gains from flight to quality in DeFi.
Takeaway: Yield-bearing stables attract in corrections - compare rates across protocols for opportunities.
Pro tip: Relative strength in red days reveals rotation - rank by 24h % vs. BTC for defensive picks.
🏦 ETF & Institutional Flows
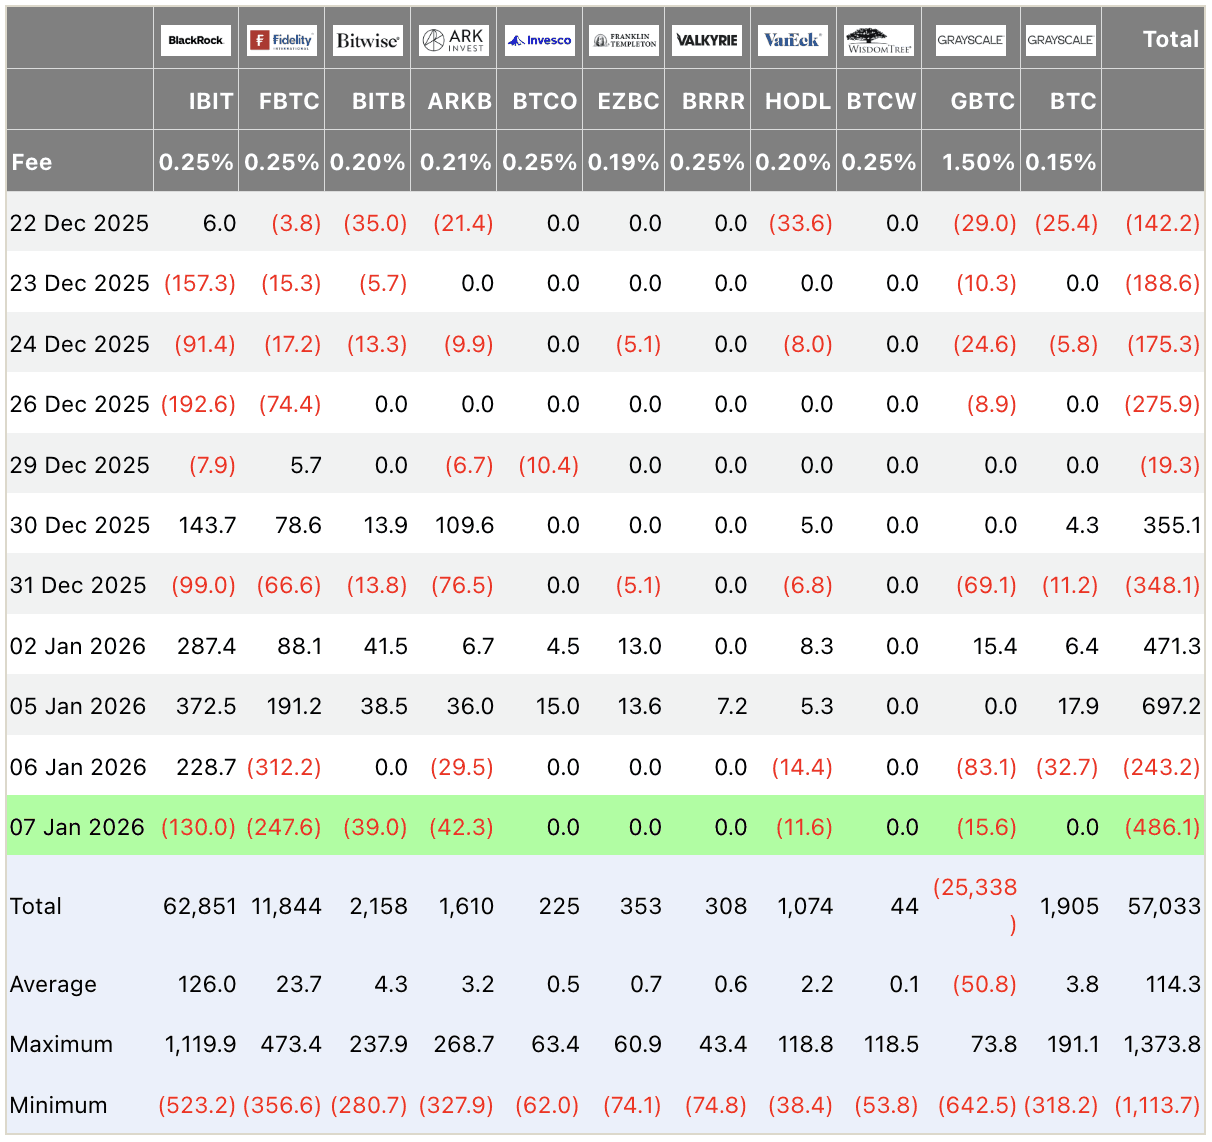
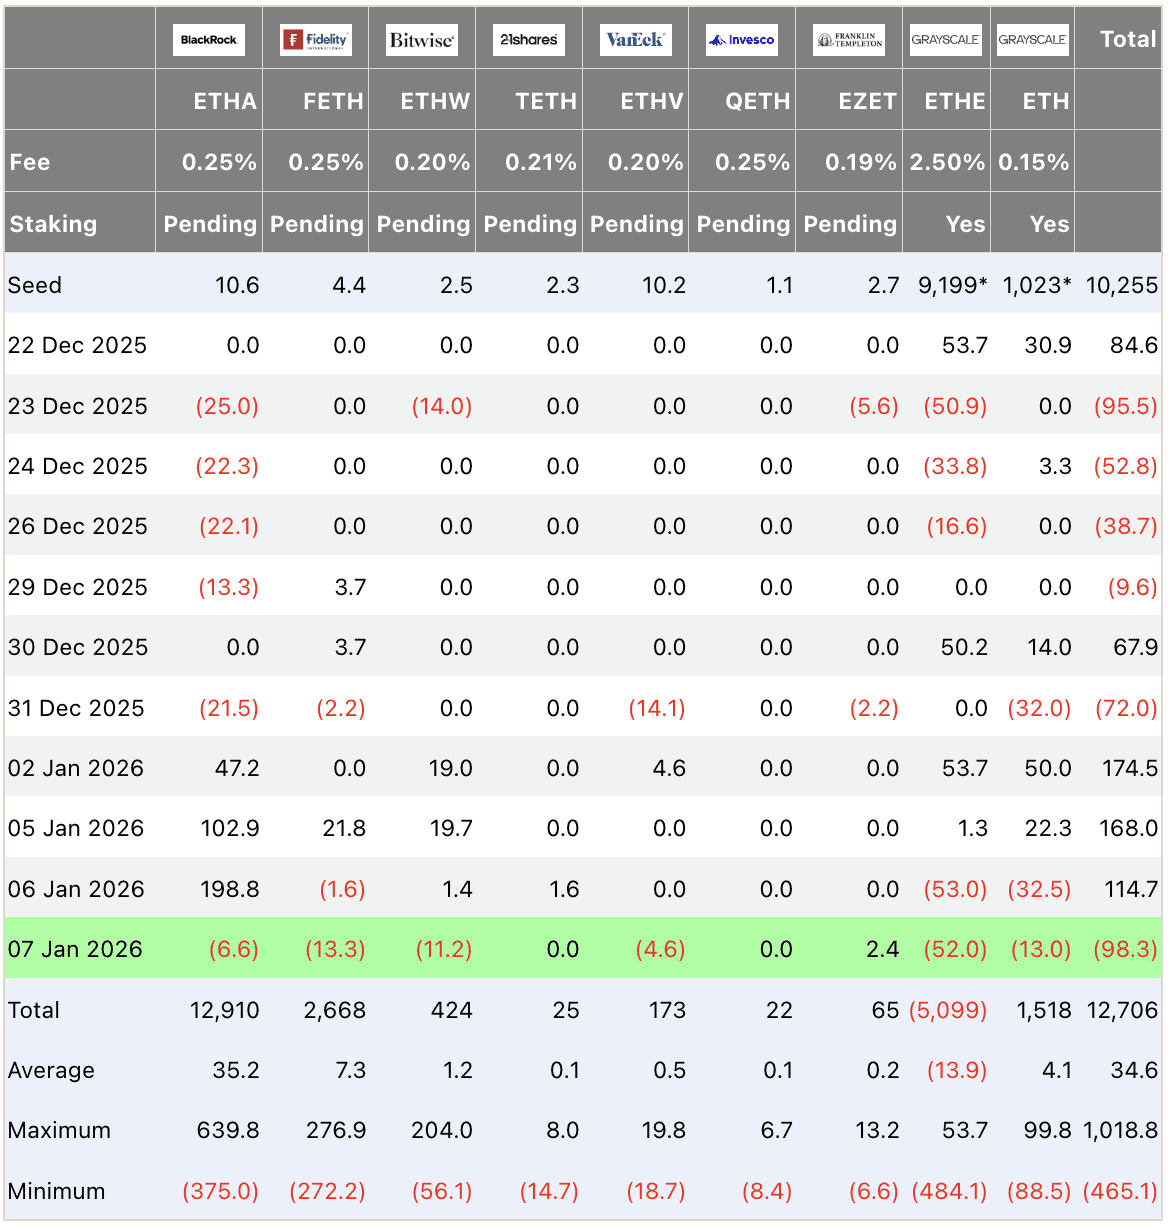
On January 7 (latest data): Bitcoin spot ETFs record net outflows of -$486.1M (led by IBIT -130.0M, FBTC -247.6M, ARKB -42.3M). Ethereum ETFs -$98.3M (ETHA -6.6M, FETH -13.3M dominant). Extended profit-taking post-early year rally weighs on sentiment, amplifying correction.
Bitcoin ETF Flow (US$m)
Ethereum ETF Flow (US$m)
Why outflows matter now? Mid-week resets can extend dips - watch for weekend stabilization signals.
⛓️ On-Chain Metrics Today
Bitcoin exchange reserves see minor uptick from selling, but long-term holders remain net accumulators. Whale distributions limited. Hash rate resilient near peaks. Overall: temporary pressure without capitulation, supporting potential rebound.
Takeaway: Minor reserve increases flag short-term selling - contrast with LTH supply for conviction.
🌍 Macro Pulse
Fed debates intensify on tariff long-term effects: deflationary growth drag vs. short-term inflation. Officials split on cut timing amid stable jobs data. Crypto feels risk-off tone, but liquidity tailwinds persist.
How tariffs shape policy? Potential dovish pivot if deflationary - monitor bond yields for clues.
💡 Market Trend Spotlight
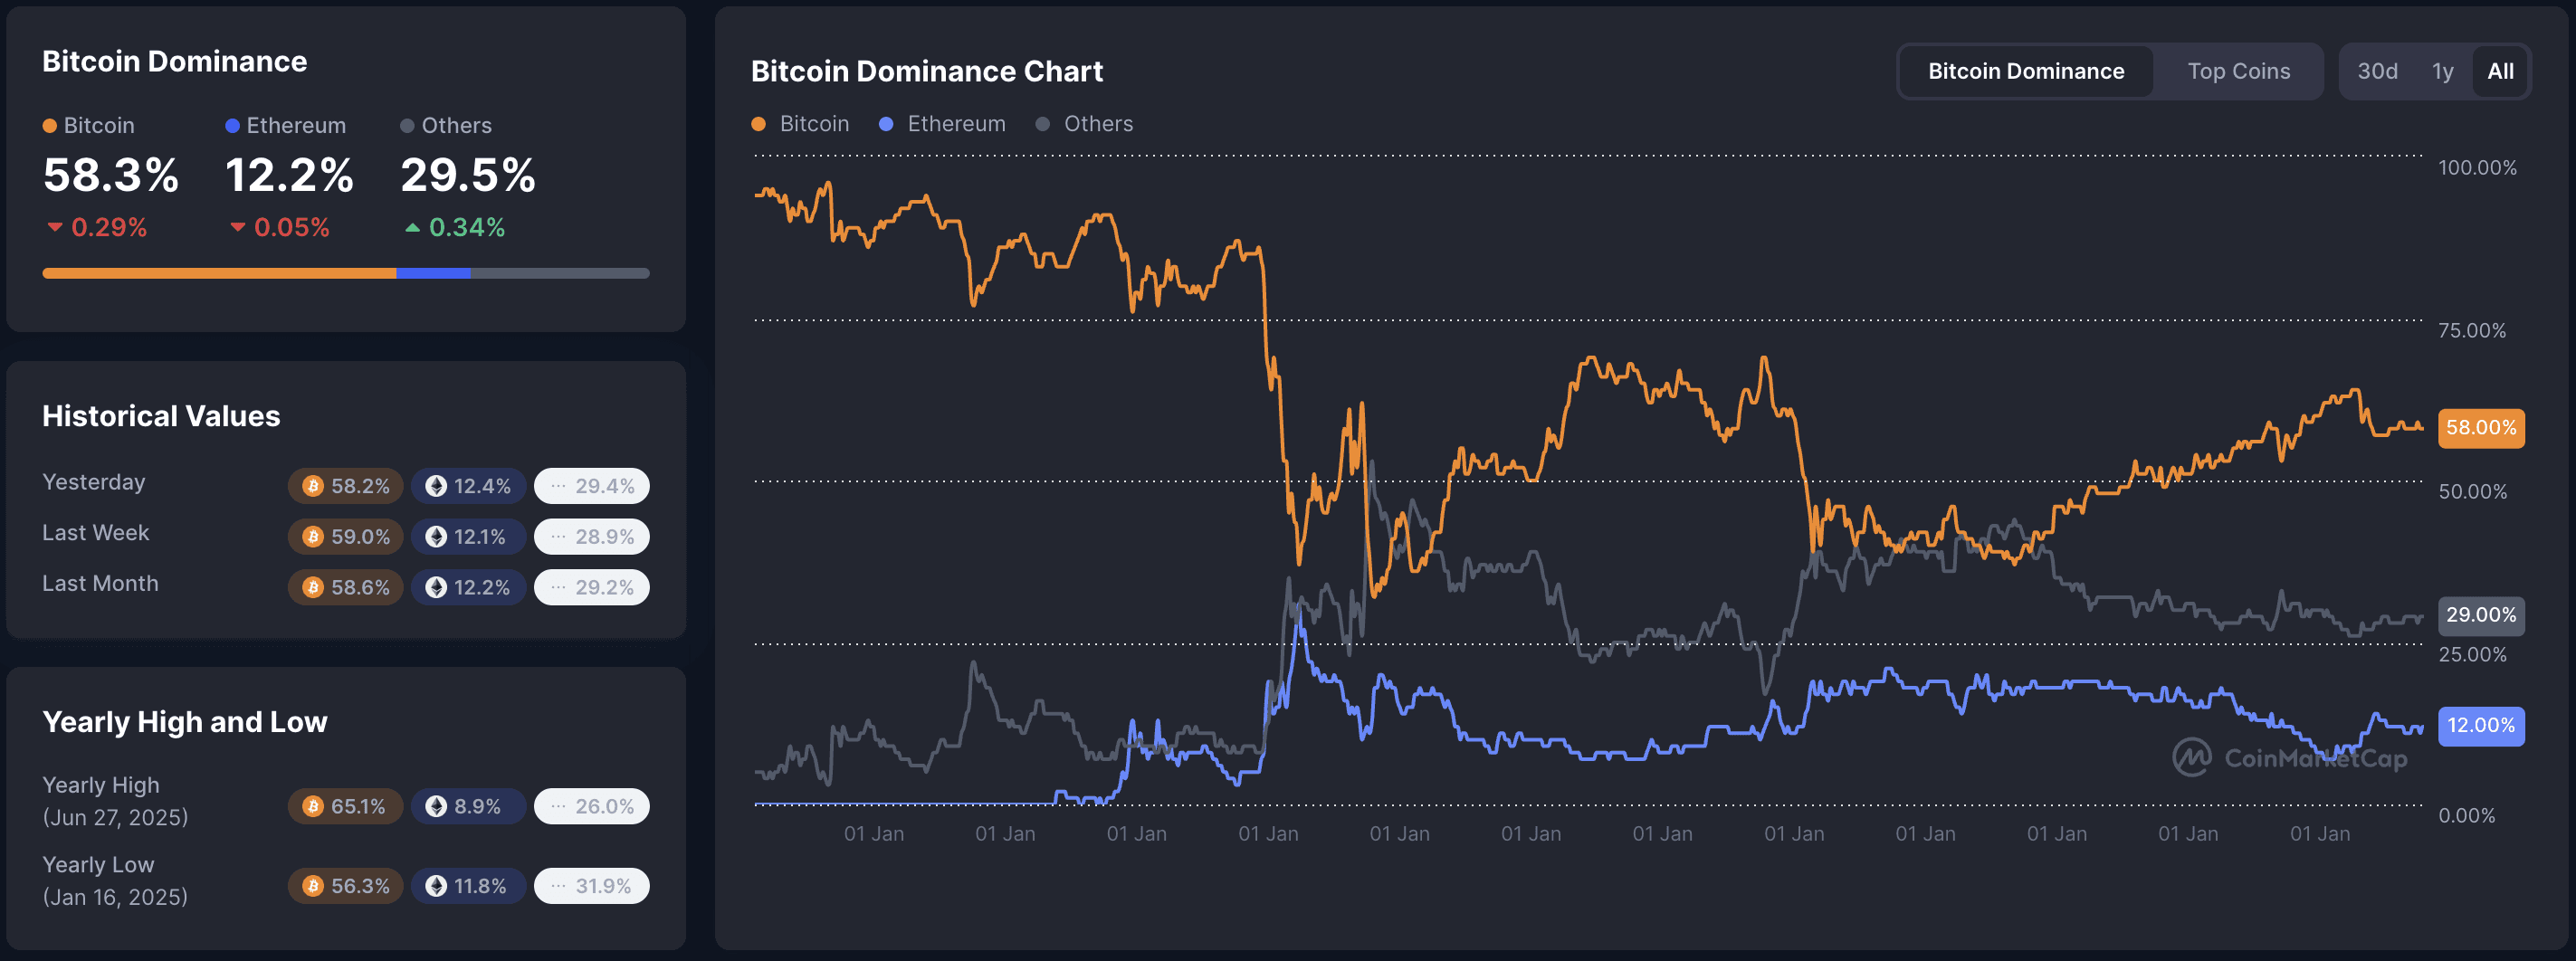
Trend of the day: Correction with selective resilience. BTC dominance at 58.3% steady as majors pull back, price tests $90K floor. Neutral sentiment + outflows indicate healthy reset. Metrics: alt index ~25, privacy volume up.
How to time corrections? Oversold RSI + volume dry-up often bottom signals - pair with flow reversals.
📰 Top News
ETF outflows accelerate Jan 7: -$486M BTC, -$98M ETH - profit-taking dominates post-rally.
MSCI keeps crypto treasury firms in indexes - Strategy, others unaffected.
Bernstein forecasts tokenization supercycle: stablecoins to $420B by year-end.
Fed sees tariffs as potentially deflationary long-run - easing growth pressures.
Privacy/utility hold ground: LEO +1.7%, amid broader market dip.
📊 Daily Wrap-Up
Jan 7 sees extended correction: BTC/alt declines with ETF outflows and neutral mood underscore reset after strong start. Key drivers - rebalancing sales offset by niche strength - maintain cautious balance. Focus on flow turnaround and macro updates for direction.
P.S. 4-6 min read. Free daily alpha. Unsubscribe anytime. © Web Snack 2025.
This newsletter is for informational purposes only and does not constitute investment advice. Always conduct your own research and make independent decisions.
