Crypto market pulls back modestly after early 2026 gains: total cap at $3.18T with Bitcoin down -0.6% to ~$92.8K on profit-taking...

🍪 Today’s Snack
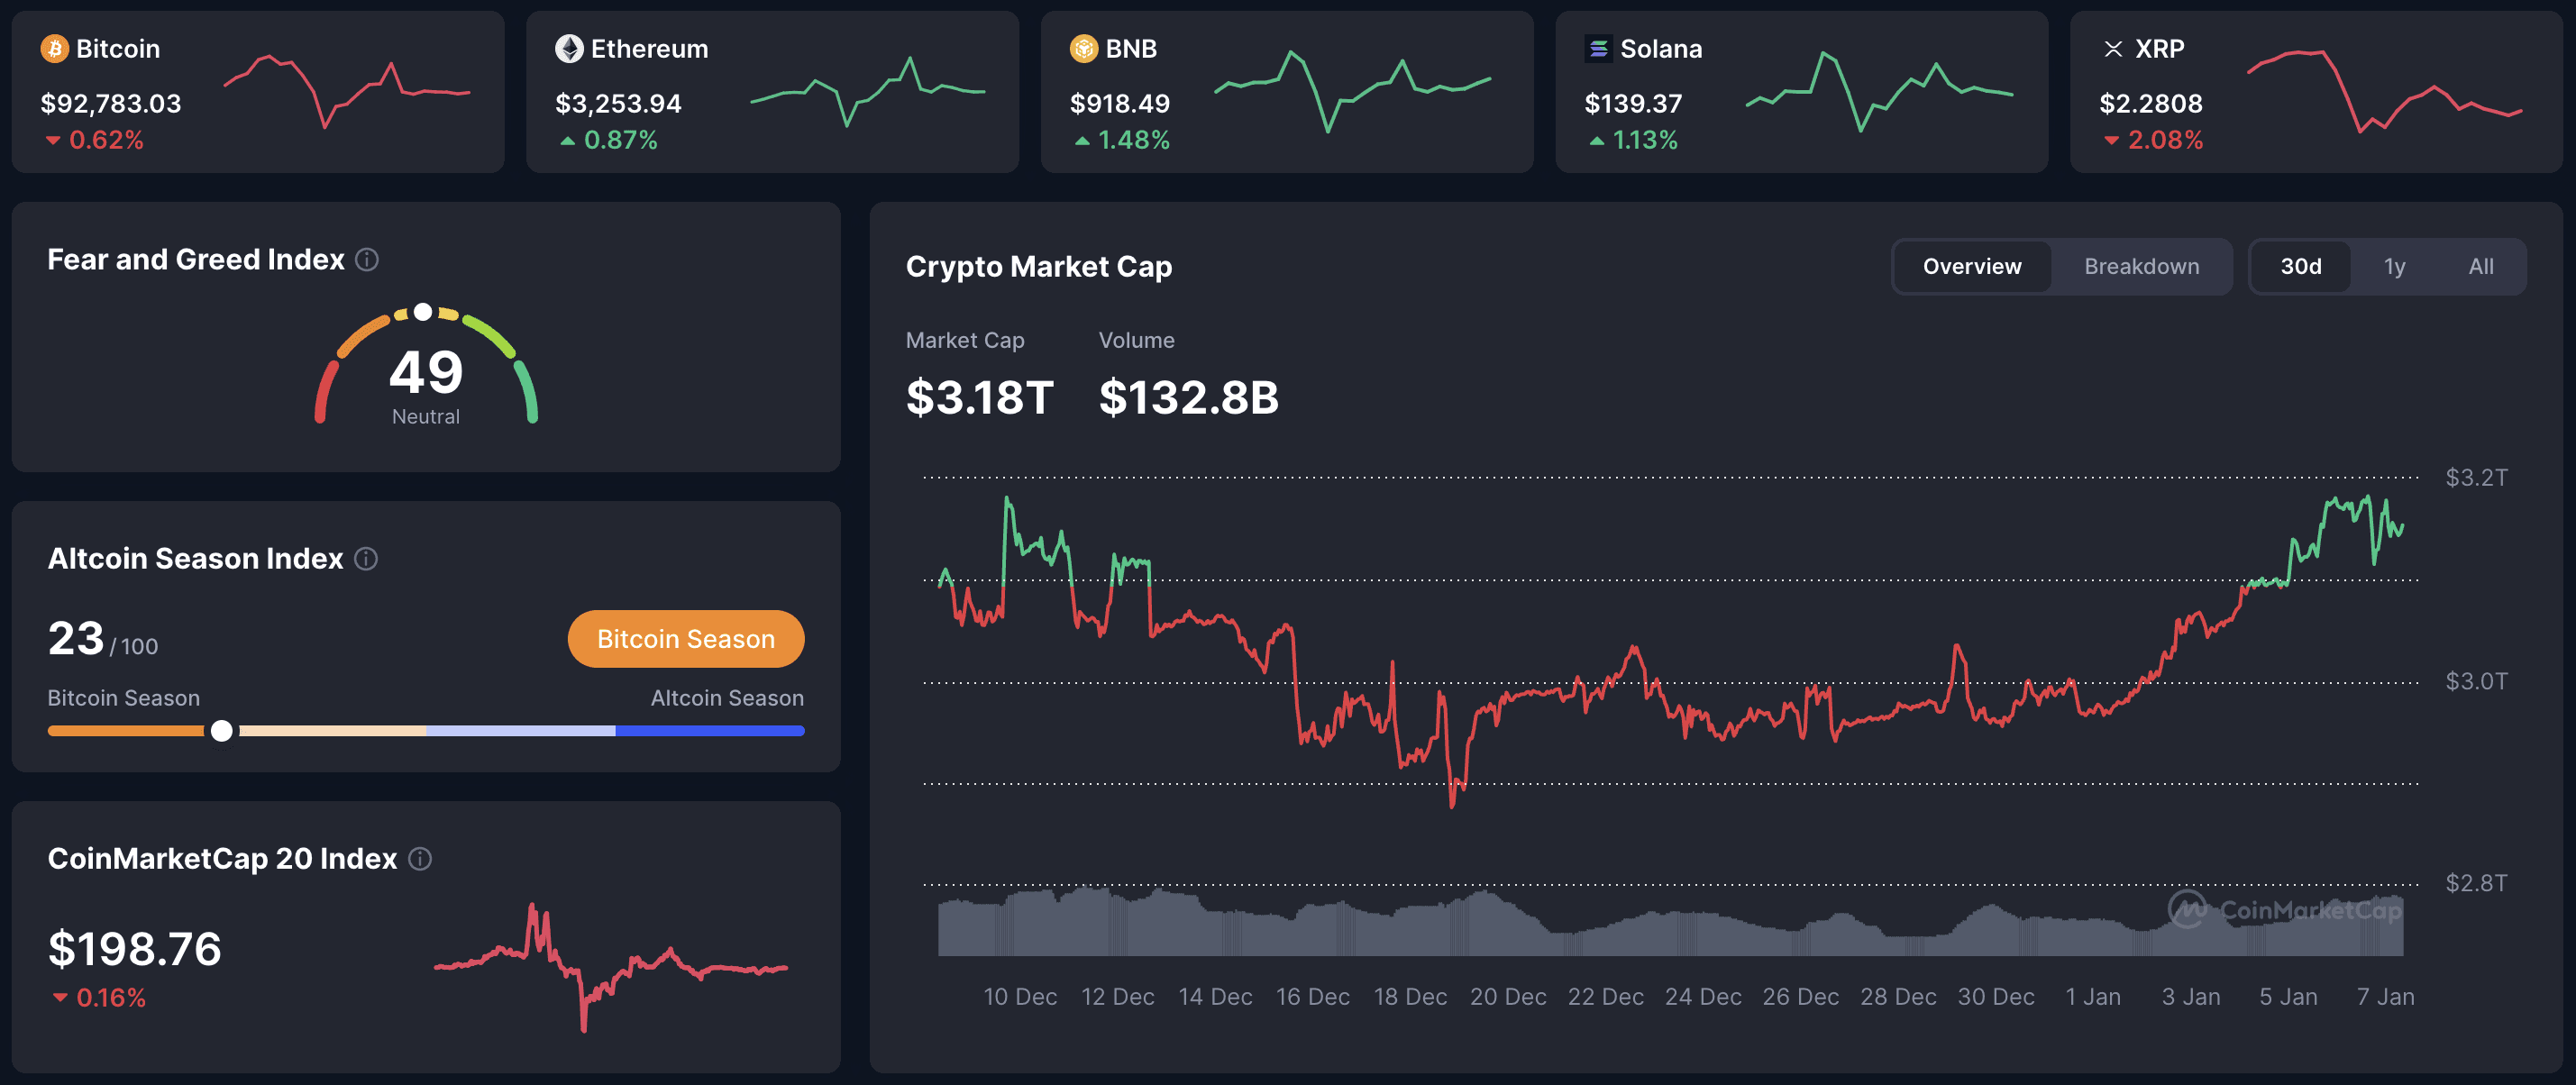
Crypto market pulls back modestly after early 2026 gains: total cap at $3.18T with Bitcoin down -0.6% to ~$92.8K on profit-taking, while niche sectors like memes and perps show relative strength in mixed trading.
📈 24h Crypto Market Snapshot
Total cryptocurrency market cap stands at $3.18T (-~0.5% over 24h per CoinMarketCap). The Fear & Greed Index is at 49 (Neutral), indicating balanced sentiment following holiday volatility.
Asset | Price (USD) | 24h Change | Market Cap (USD) |
|---|---|---|---|
BTC | $92,783 | -0.62% | $1.85T |
ETH | $3,254 | +0.87% | $392B |
BNB | $918 | +1.48% | $126B |
XRP | $2.28 | -2.08% | $138B |
SOL | $139 | +1.13% | $78B |
ADA | $0.419 | +0.59% | $15.1B |
How to read neutral sentiment? Index around 50 often signals consolidation - combine with volume trends to gauge if dip-buying emerges.
🔥 Top 3 Movers & Shakers
Rain (RAIN) - +11.3%: Prediction market token surges on renewed speculation and platform activity.
Takeaway: Speculative niches rebound fastest post-holidays - track user growth for sustainability.
MemeCore (M) - +7.0%: Community-driven meme token gains from social momentum revival.
Takeaway: Sentiment-driven assets lead rotations - monitor mention spikes on platforms like X.
Hyperliquid (HYPE) - +4.3%: Perpetual DEX token benefits from trading volume uptick.
Takeaway: DeFi perps capture leverage flows - watch open interest for directional clues.
Why focus on niche leaders? Outperformers in down days highlight rotation pockets - prioritize volume-backed moves over pure % gains.
🏦 ETF & Institutional Flows
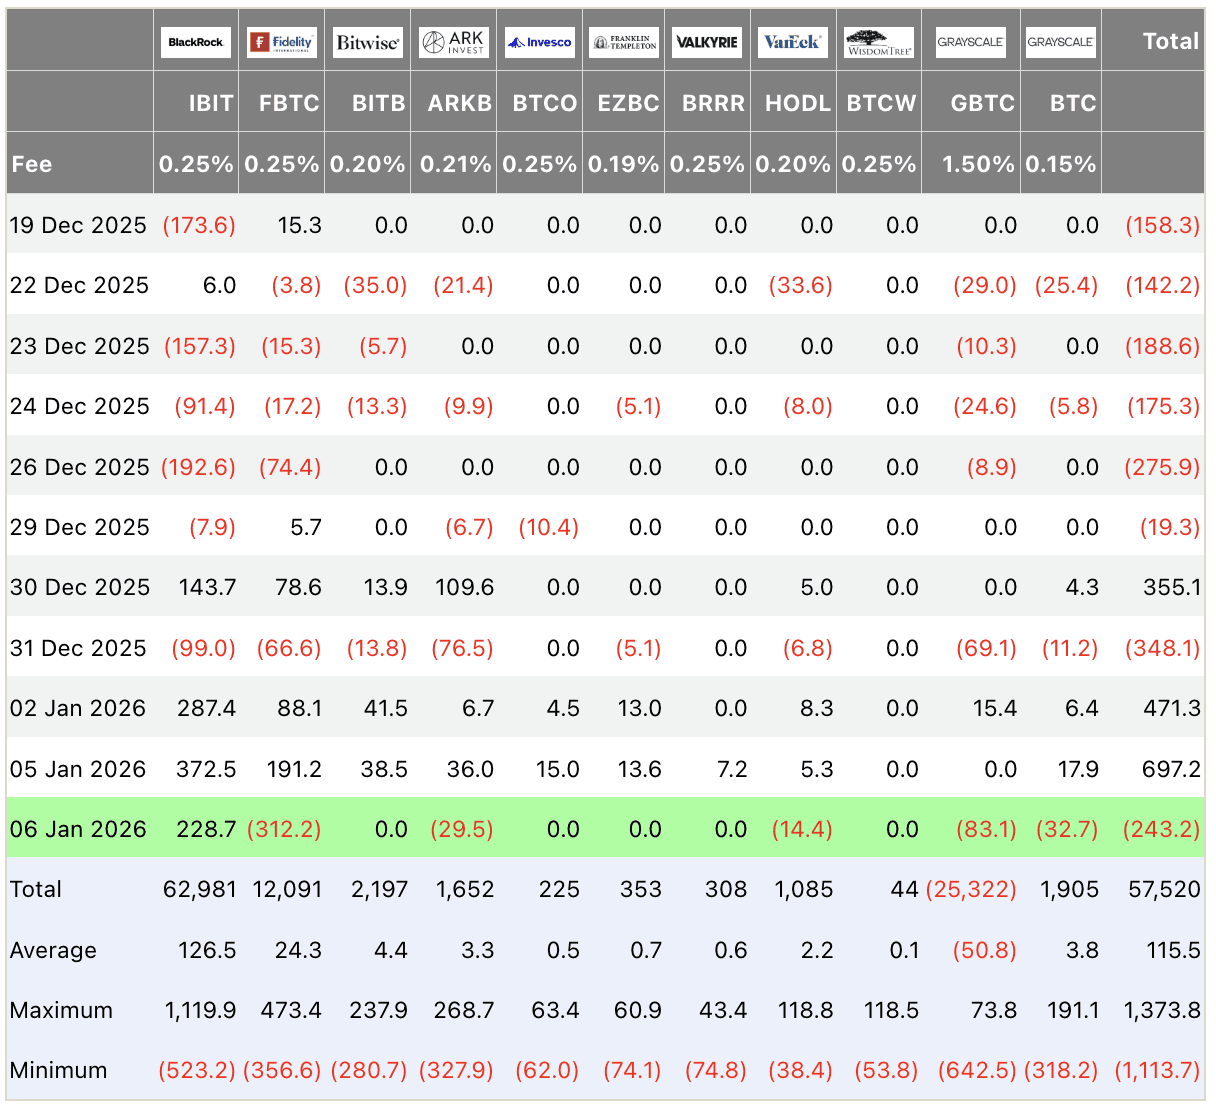
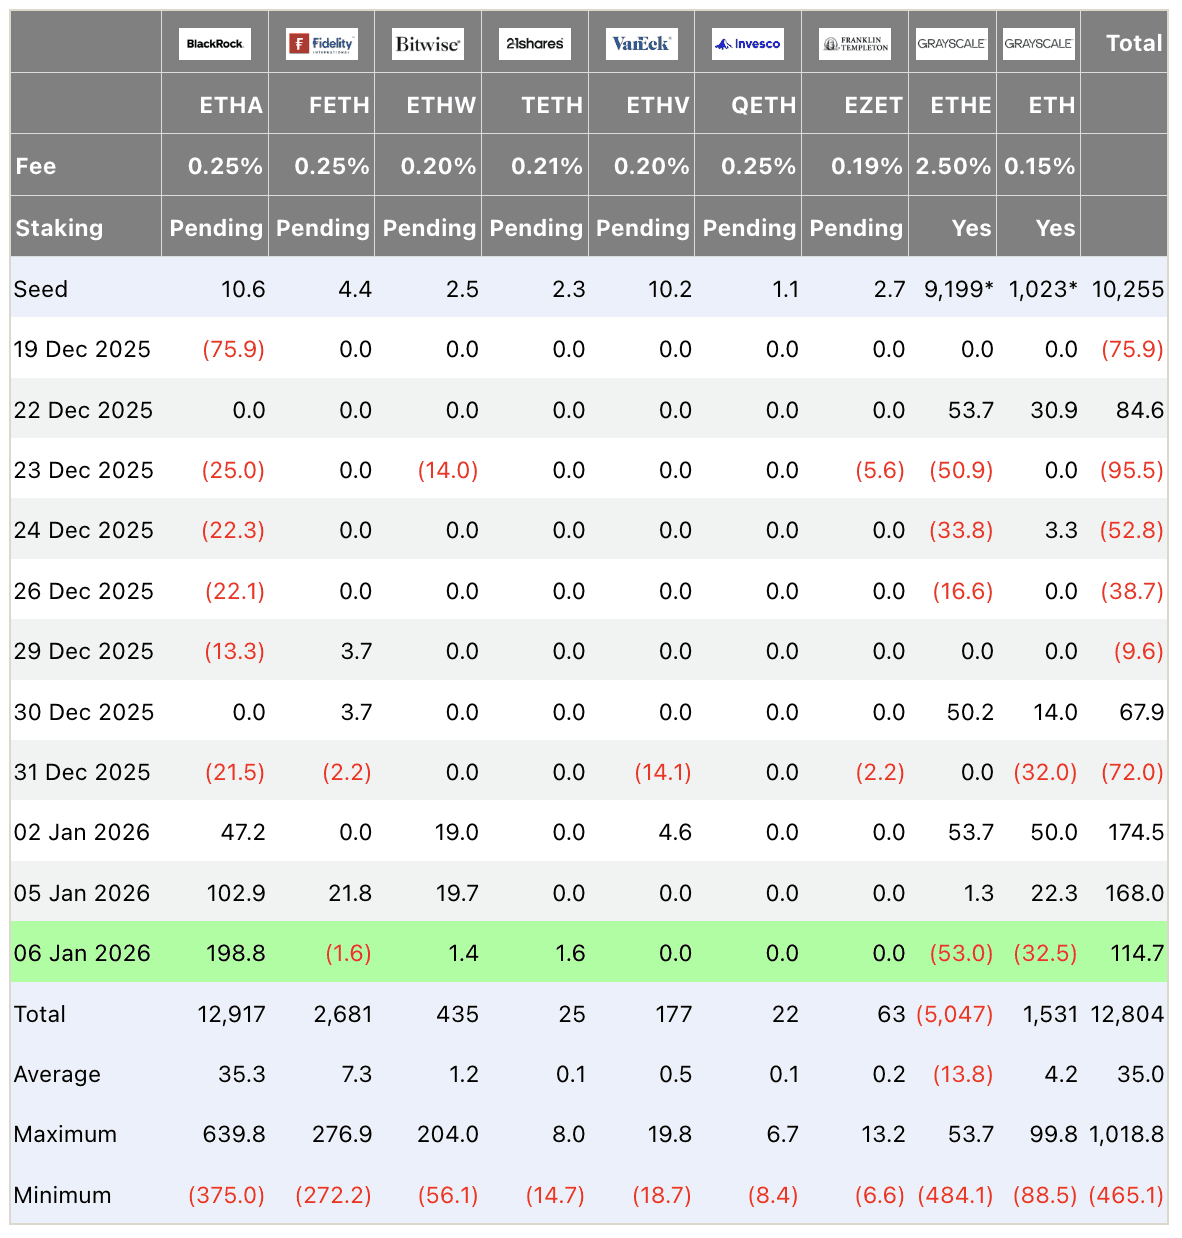
On January 6 (latest data): Bitcoin spot ETFs record net outflows of -$243.2M (IBIT -228.7M, FBTC -312.2M offset by minor inflows elsewhere). Ethereum ETFs +114.7M (ETHA +198.8M dominant). Pullback reflects profit-taking after strong early-year inflows, amid broader rebalancing.
Bitcoin ETF Flow (US$m)
Ethereum ETF Flow (US$m)
What do temporary outflows mean? Post-rally resets common in January - sustained positives rebuild conviction faster.
⛓️ On-Chain Metrics Today
Bitcoin exchange reserves stable with minor inflows, suggesting balanced holder behavior. Whale activity muted without large dumps. Hash rate near ATH supports network security. Overall: no panic signals, market digests gains in low-vol environment.
Pro tip: Watch reserve trends weekly - steady or declining levels favor accumulation phases.
🌍 Macro Pulse
Fed research highlights potential long-term deflationary tariff effects via slower growth, countering short-term inflation fears. Officials remain divided on cut pace amid stable unemployment ~4.2%. Risk assets supported by liquidity expectations, though geopolitical hedges (gold/BTC) noted.
Why tariffs matter less long-term? Growth drag may offset price pressures - track PCE data for Fed reaction function.
💡 Market Trend Spotlight
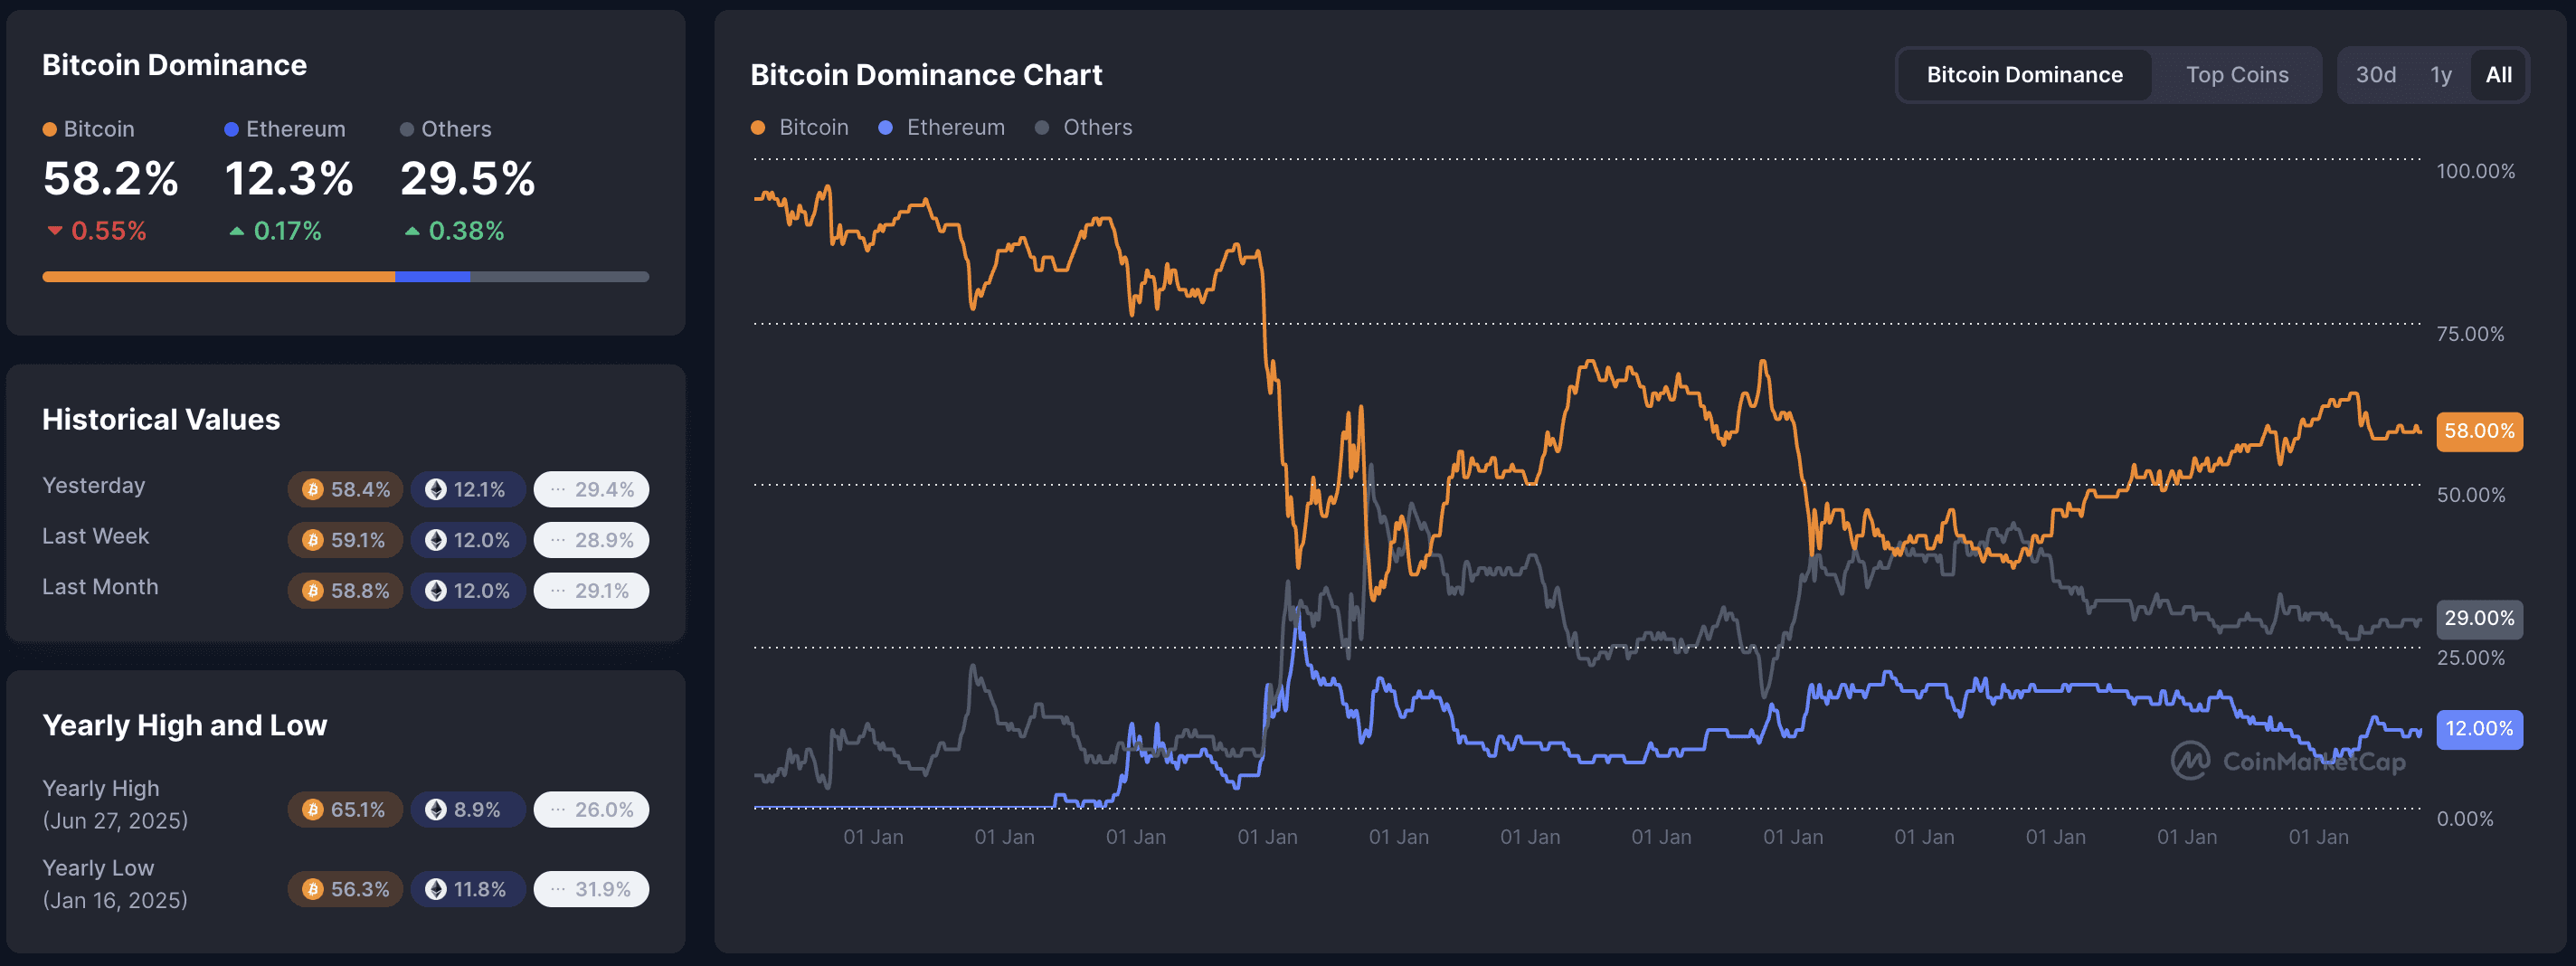
Trend of the day: Post-holiday consolidation with niche strength. BTC dominance at 58.2% holds as core assets correct modestly, price tests $92K support. Neutral sentiment + lower volume indicate digestion phase. Metrics: alt season index ~23, meme/perp volume elevated.
How to spot digestion bottoms? Look for volume contraction + RSI oversold - often precedes renewed bids.
📰 Top News
Morgan Stanley files for spot Bitcoin & Solana ETFs - deepening traditional finance push into crypto.
ETF outflows Jan 6: -$243M BTC, +$115M ETH - profit-taking after early 2026 surge.
Tom Lee reiterates BTC new ATH possible January - cites cycle extension.
Fed views tariffs potentially deflationary long-term - via uncertainty and reduced activity.
Meme & prediction tokens outperform: Rain +11%, signaling speculative rotation.
📊 Daily Wrap-Up
Market takes breather on Jan 6: modest BTC/ETH pullback offset by niche gains and neutral mood, following strong inflows earlier in week. Key drivers - rebalancing flows and macro debates - maintain constructive base. Watch ETF reversal and dominance for rotation confirmation.
P.S. 4-6 min read. Free daily alpha. Unsubscribe anytime. © Web Snack 2025.
This newsletter is for informational purposes only and does not constitute investment advice. Always conduct your own research and make independent decisions.
